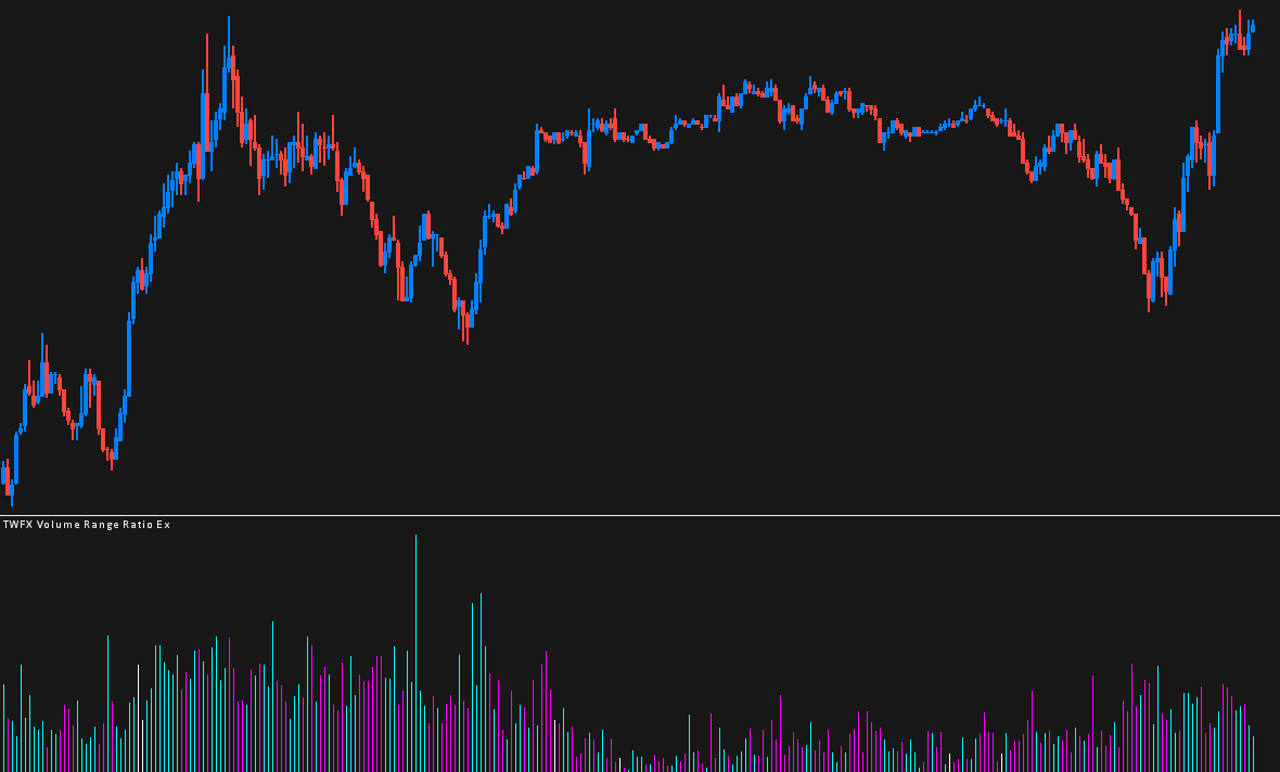
The Volume Range Ratio Ex study displays the traded volume for each chart bar divided by the range of the bar. In addition to optionally displaying as average volume per tick, the study also provides the option to either: Color the subgraph outputs based on which of ask or bid has greater volume; or base the subgraph output on which ever is greater from ask or bid volume, and color accordingly.
Note:
- This study can only be used on charts with a chart data type of ‘Intraday Chart‘
- It is recommended to use ‘Intraday Data Storage Time Unit‘ setting ‘1 Tick’
Inputs
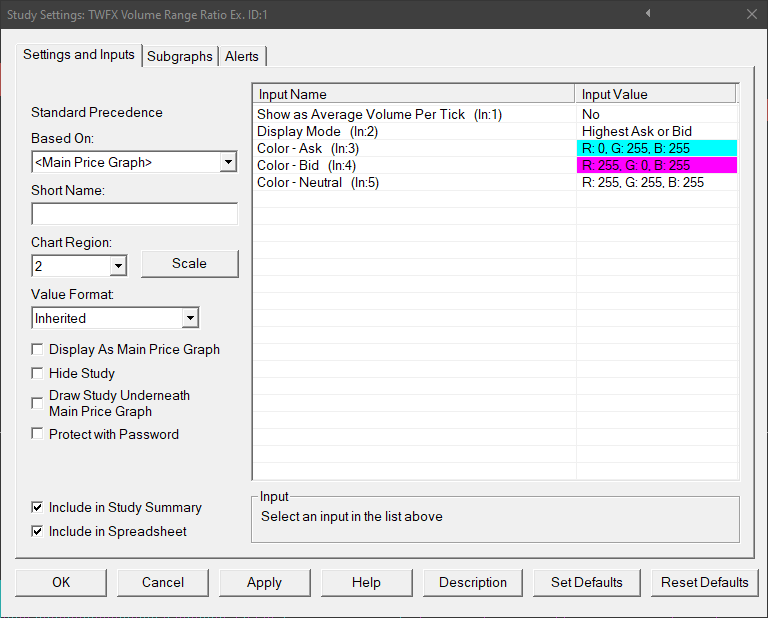
Show as Average Volume Per Tick (In:1)
When enabled, the study displays Volume / Bar Range in Ticks, giving the average Volume Per Tick.
Display Mode (In:2)
- Total Volume:
Subgraph output value is based on Total Volume / Bar Range, all bars are colored using ‘Color – Neutral’. - Total Volume Colored by Dominant Side:
Subgraph output value is based on Total Volume / Bar Range, chart bars are colored according to which of ask or bid has the greatest volume.- Ask Volume > Bid Volume
Color: Color – Ask - Bid Volume > Ask Volume
Color: Color – Bid - Ask Volume = Bid Volume
Color: Color – Neutral
- Ask Volume > Bid Volume
- Highest Ask or Bid:
Subgraph output value is based on the greater of Ask or Bid Volume, and colored accordingly- Ask Volume > Bid Volume
- Color: Color – Ask
- Output: Ask Volume / Bar Range
- Bid Volume > Ask Volume
- Color: Color – Bid
- Output: Bid Volume / Bar Range
- Ask Volume = Bid Volume
- Color: Color – Neutral
- Output: Ask Volume / Bar Range
- Ask Volume > Bid Volume
Color – Ask (In:3)
Defines the color used when Ask Volume > Bid Volume
Color – Bid (In:4)
Defines the color used when Bid Volume > Ask Volume
Color – Neutral (In:5)
Defines the color used when Ask Volume = Bid Volume


