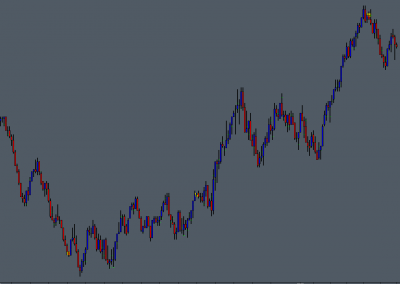
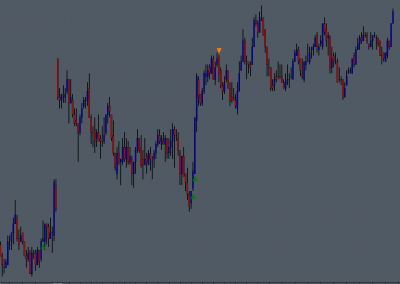
New Free Studies Added 10 new studies have been added to the Free Studies Collection, including a selection of simple zig zag rotation studies, based on a modified version of the native Sierra Chart Zig Zag study. A Trade Screen Shot study is also now included with...
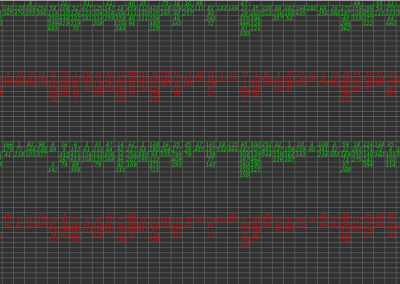
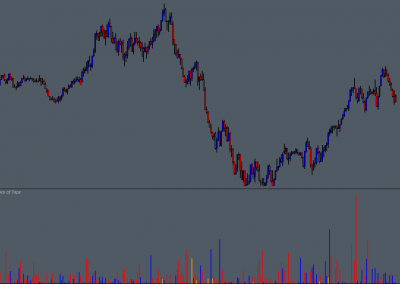
Sierra Chart Trade Tape Study: Evaluate time & sales data / orderflow; Combine limit orders to show market orders; Filter using volume; Display using Trade Dot and/or text.
Sierra Chart Reconstructed Tape Chart Study: Build a custom chart from time & sales data / orderflow; Choose the aggregation mode; Filter using trade volume; Visualize relative order sizes using volume dot display; Display large orders and stop orders.
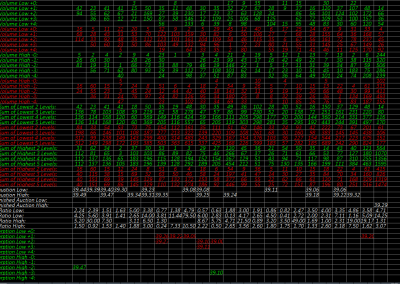
Part of the Free Studies Collection: Sierra Chart Ask Bid Pulling & Stacking study - Monitor pulling and stacking of orders over the first 15 market depth levels.
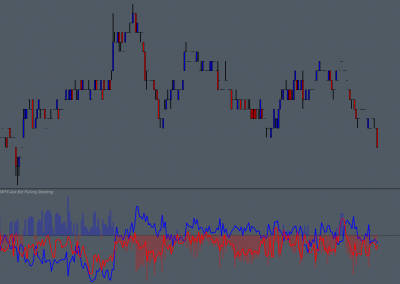
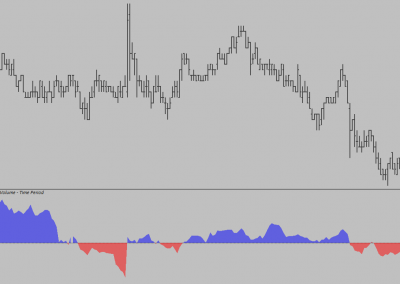
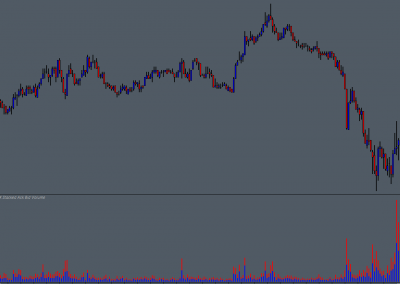
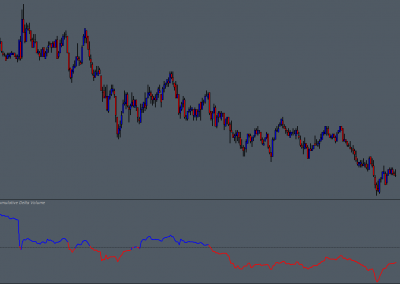
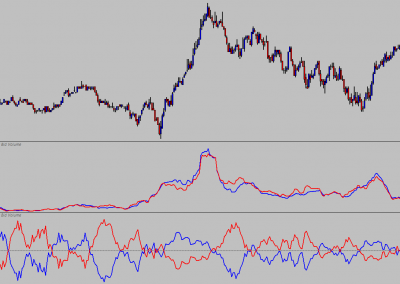
Part of the Free Studies Collection: Sierra Chart Cumulative Delta - Time Period Study - Monitor trends in strength of buyers and sellers, per day, per session or continuous rolling sum.
Part of the Free Studies Collection: Sierra Chart Volume at Price for Bars Study - Expose volume at price data to subgraphs, enable additional analysis of data.
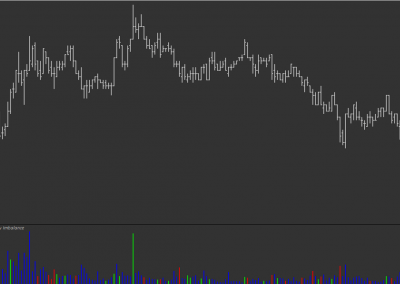
Part of the Free Studies Collection: Sierra Chart Volume Colored by Imbalance Study - Monitor traded volume, display and highlight based on dominant side.
Part of the Free Studies Collection:
Sierra Chart Pace of Tape Study - Monitor the rate at which orders are being filled, identify areas of interest when trade activity accelerates.
Part of the Free Studies Collection: Sierra Chart Volume at Price and Orderflow Analysis Study - Monitor lowest and highest price levels (upto 5) for each price bar Evaluate order flow behaviour against specified conditions.
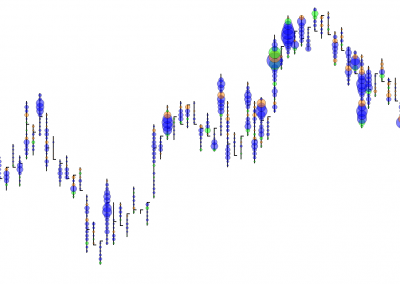
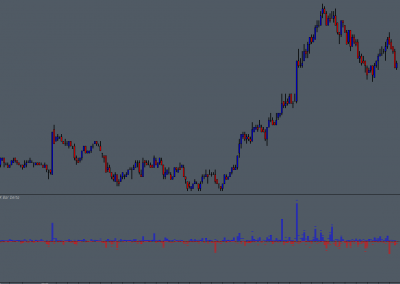
Part of the Free Studies Collection: Sierra Chart Stacked Ask Bid Volume Study - Display traded volume histogram, showing total volume per bar divided into constituent Ask & Bid components.
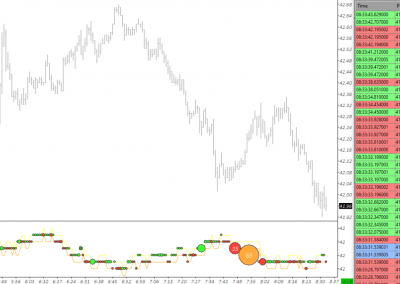
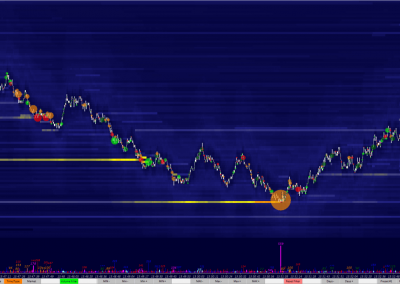
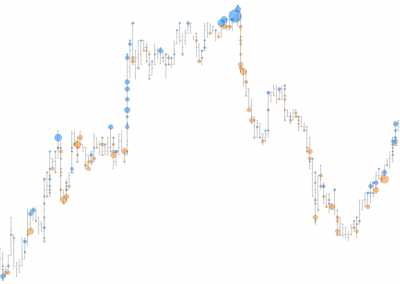
Part of the Free Studies Collection: Sierra Chart Swing Delta Study - Monitor Ask Bid Delta for each minor price rotation, also, optionally show mimimum and maximum delta.
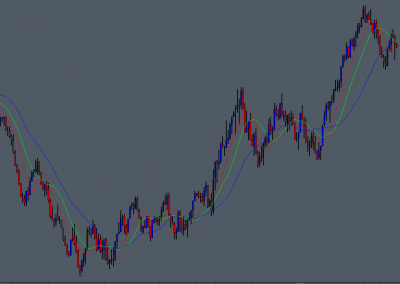
Part of the Free Studies Collection: Sierra Chart POC per Bar Study - Highlight the Volume Point of Control for each price bar, optional additonal highlighting where specified volume threshold is exceeded.
Part of the Free Studies Collection: Sierra Chart POC per Bar with Moving Averages Study - Track and Monitor trends in per bar Volume Point of Control migration using moving average(s)
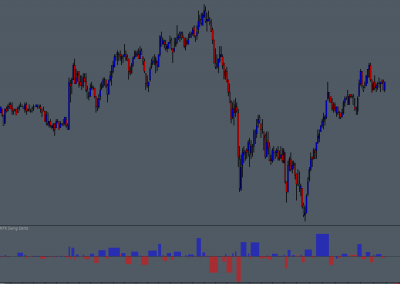
Part of the Free Studies Collection: Sierra Chart Bar Delta Study - Monitor the Ask vs. Bid difference (Delta) per bar, identify the aggressor, find divergence between aggression and price action.
Part of the Free Studies Collection: Sierra Chart Stacked Ask Bid Volume Study Ex - Extended version of Stacked Ask Bid Volume, including moving averages with standard deviation and percentage bands.
Part of the Free Studies Collection: Sierra Chart Bar Delta Imbalance Study - Be alerted when Bar Delta exceeds Delta Imbalance % threshold and, optionally, minimum total volume.
Part of the Free Studies Collection: Sierra Chart Ask Bid Volume Study - Monitor the Ask and Bid volume, identify the aggressor, find divergence between agression and price action.
The page you requested could not be found. Try refining your search, or use the navigation above to locate the post.
We use cookies to give you the best online experience, your continuing use of the website is taken to mean that you consent to the use of cookies.Read more about how we use cookies.
You can revoke your consent any time using the revoke consent button.