
The Basics
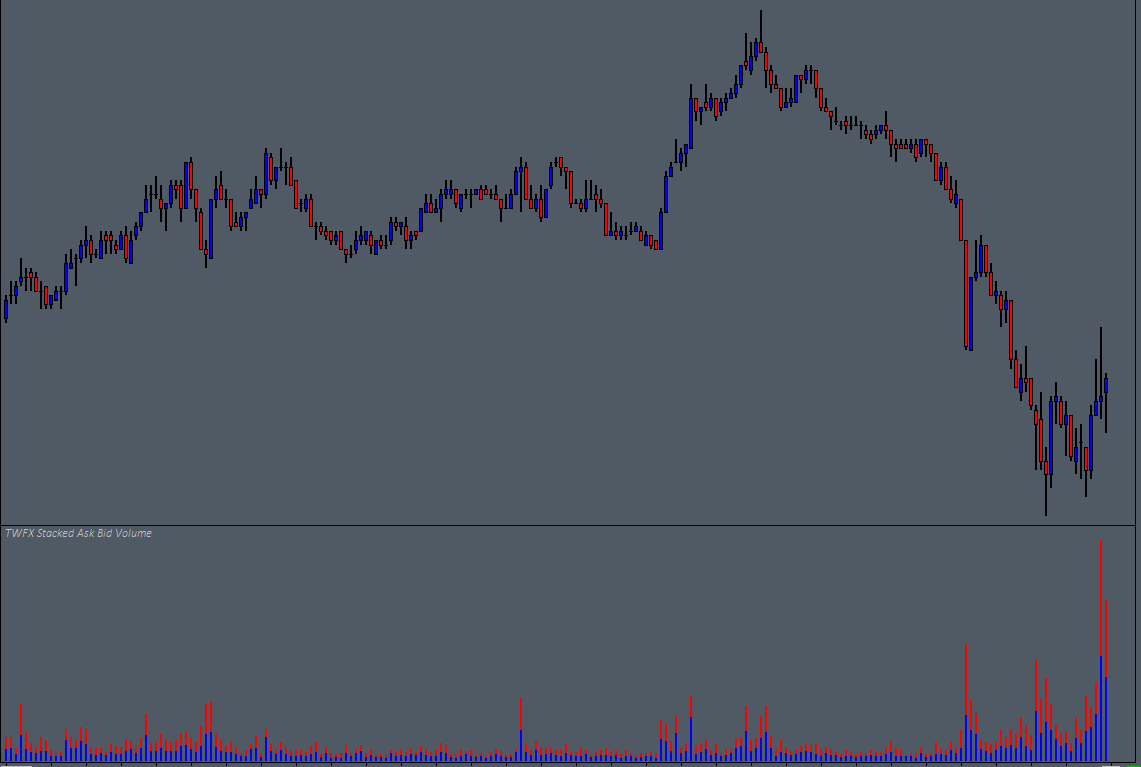
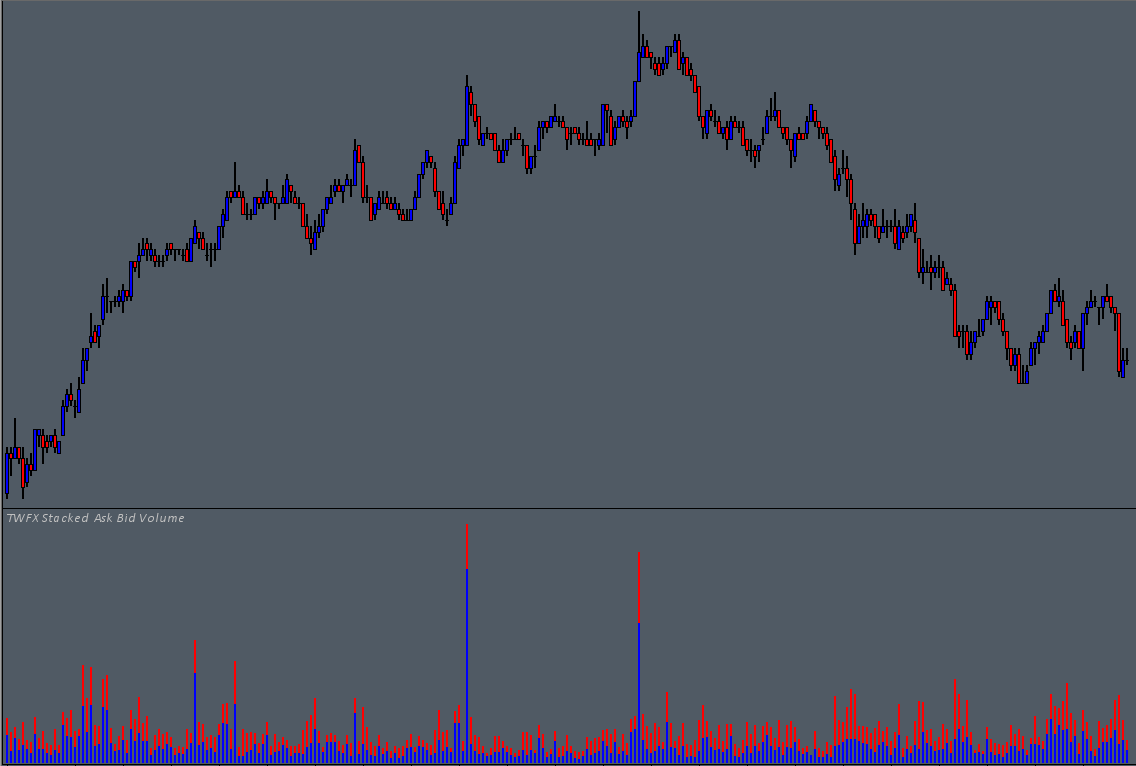
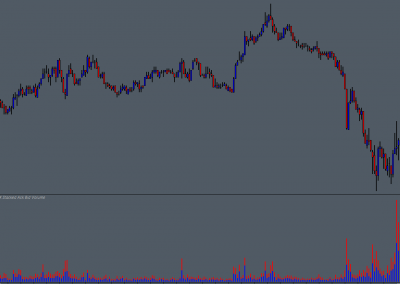
The Stacked Ask Bid Volume Study monitors Ask and Bid traded volume, and displays the data in the form of either a Stacked Bar Chart, Stacked Area Chart or Stacked Lines.
This display format can provide both a view of actual volume, combined with a view of per bar delta, although this delta view is only useful as a coarse gauge for identifying extreme imbalances between Ask and Bid volume.

Possible Uses
A simple use case could be to observe when increased volume occurs, such as when price first tests into an area of fresh liquidity (for example new high/low of day, or range breakout).
If a significant imbalance occurs between Ask and Bid volume, but upon revisiting the area this imbalance is not repeated (or it is infact reversed), this can provide an indication that the initial test may have been an exhaustive move being absorbed by passive market participants, who are now willing to push the market back in the other direction.
A little bit more about the study
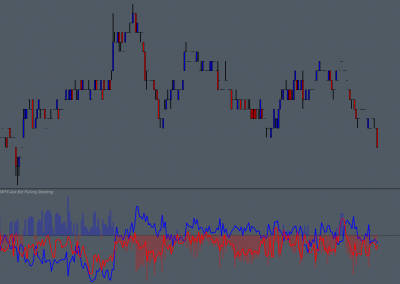
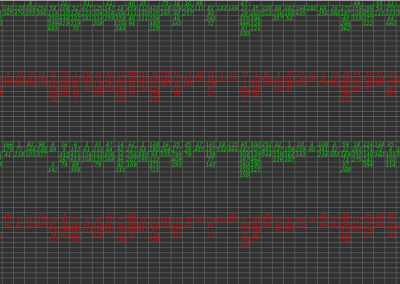
The study data is output via 3 subgraphs, the subgraph display options are limited to either Bar, Line or Area, these are configured via the study inputs rather than the subgraphs themselves. Depending on user preference, the Ask & Bid volume can be displayed as Ask first/below Bid or Bid first/below Ask.
0 Comments