
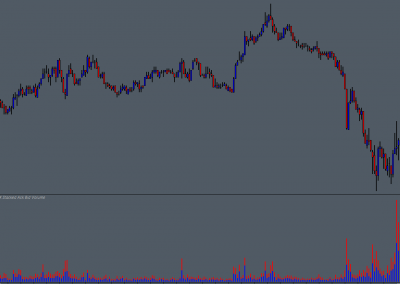
Alert
Highlight extreme delta conditions
Volume
Filter using minimum volume threshold
Imbalance
Ask/Bid imbalance percentage threshold filter
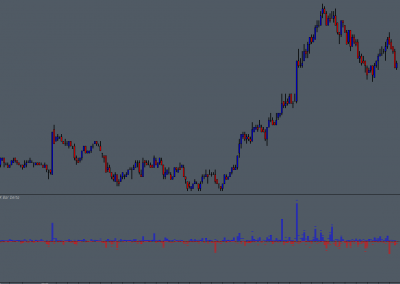
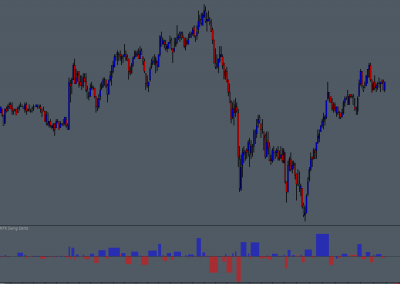
The Basics
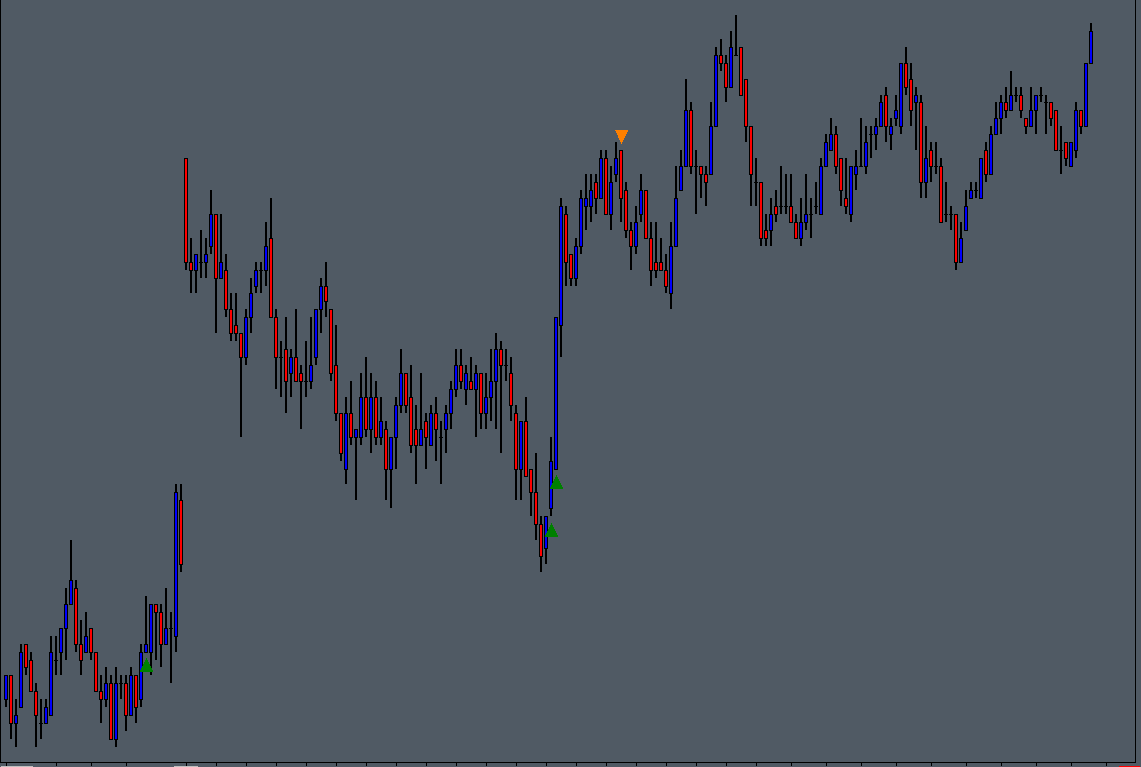
The Bar Delta Imbalance study monitors the Ask and Bid traded volume per chart bar period and provides a visible alert when the imbalance between the Ask and Bid volume meets or exceeds the defined threshold, and (optionally) the the sum of the Ask and Bid volume meets or exceeds the defined threshold.
The study can be beneficial when used in conjunction with other methods and/or studies to help qualify entry or exit conditions.
alert when the imbalance between the Ask and Bid volume meets or exceeds the defined threshold…
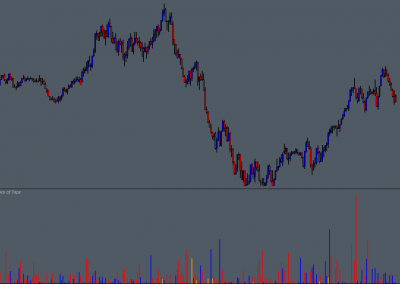
Possible Uses
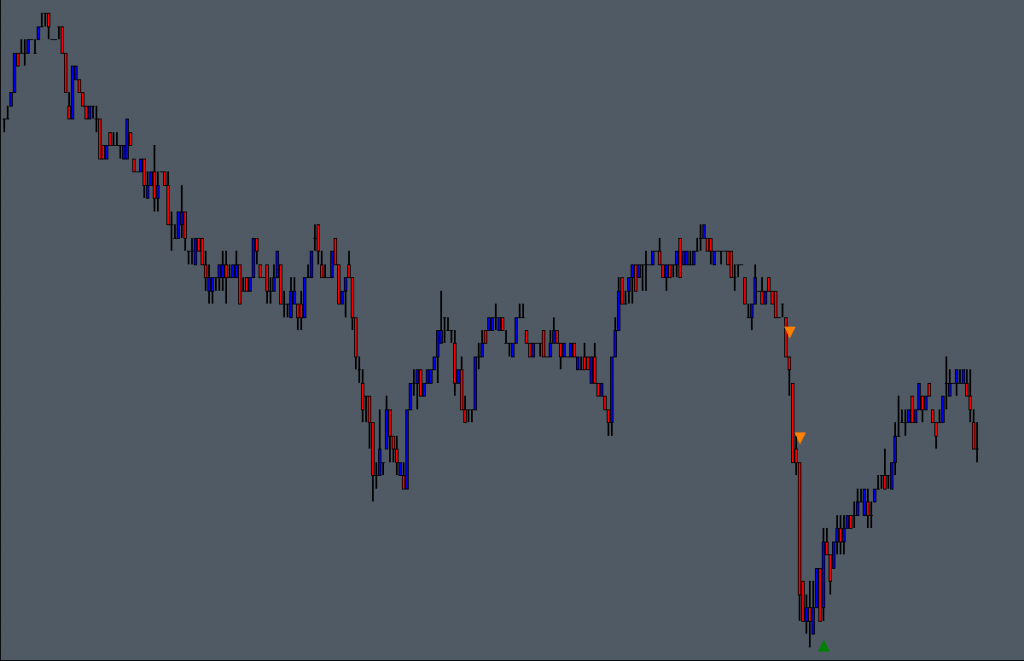
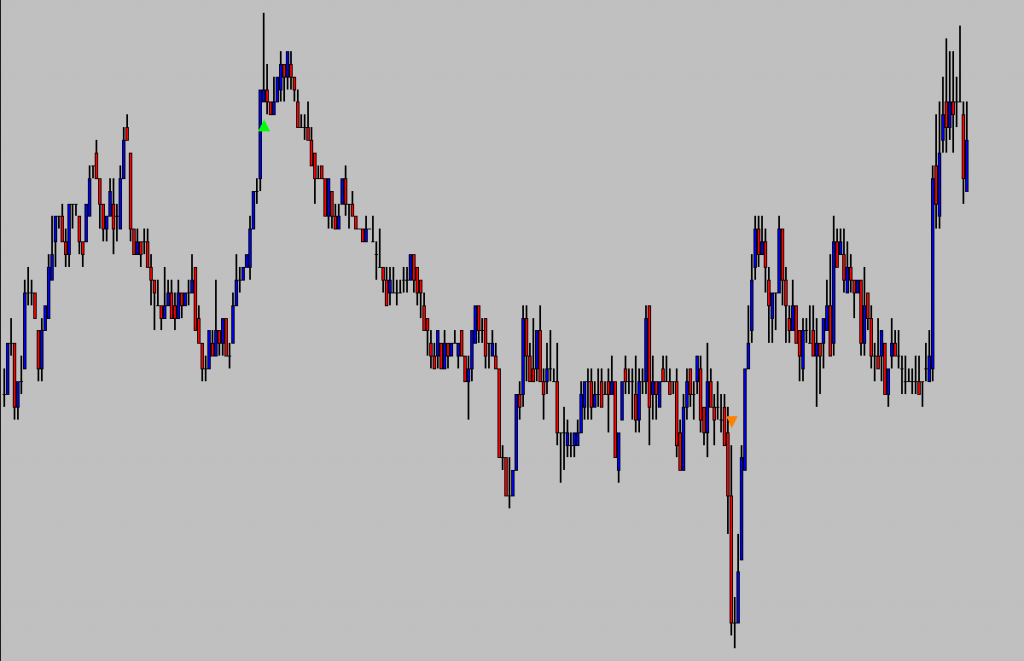
A simple use case could be to alert to high delta conditions when price tests or exceeds a structural level, such as the session high / low or the prior day high / low. Depending on the context and the initial response to the test beyond a structural level, the delta alert could be interpreted either as a continuation clue, in line with alert, or a reversal clue, in opposition to the alert.
For example, if price makes a new low through an intraday support level, whilst showing excess aggressive selling (extreme delta), but then immediately reverses, this can be a short term reversal clue in opposition to the delta alert. The aggressive sellers that caused the initial alert are potentially trapped in losing positions and their next action could be to become a buyer.
alert to high delta conditions when price tests or exceeds a structural level…
0 Comments