
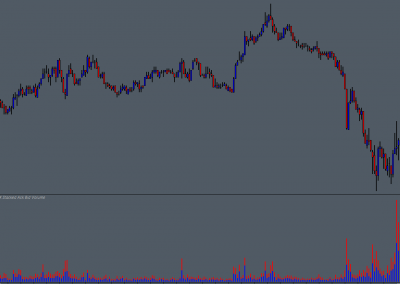
Orderflow
Monitor location of highest volume for each chart bar
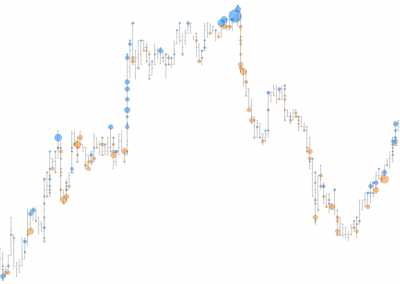
Support & Resistance
Identify potential areas of short term support or resistance
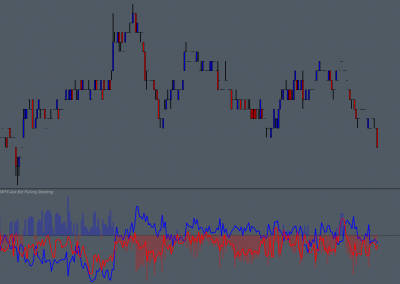
Trend
Monitor the short term POC migration trend
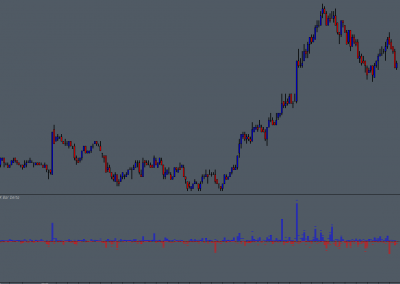
The Basics
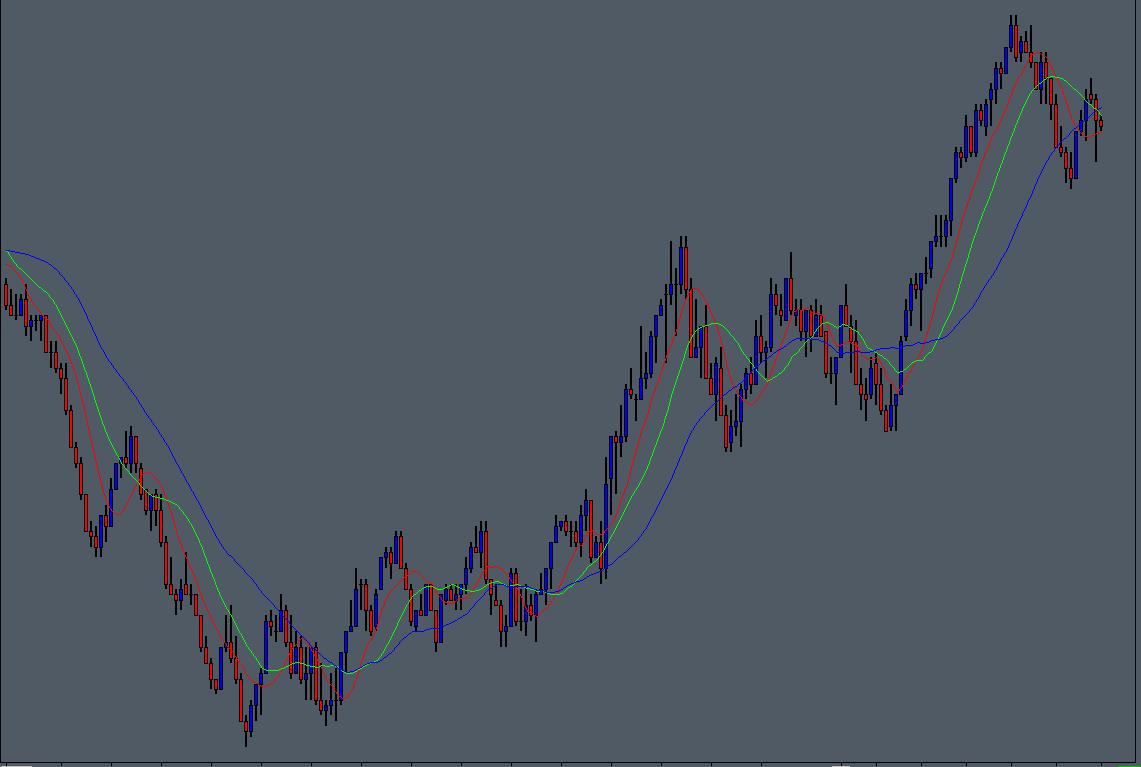
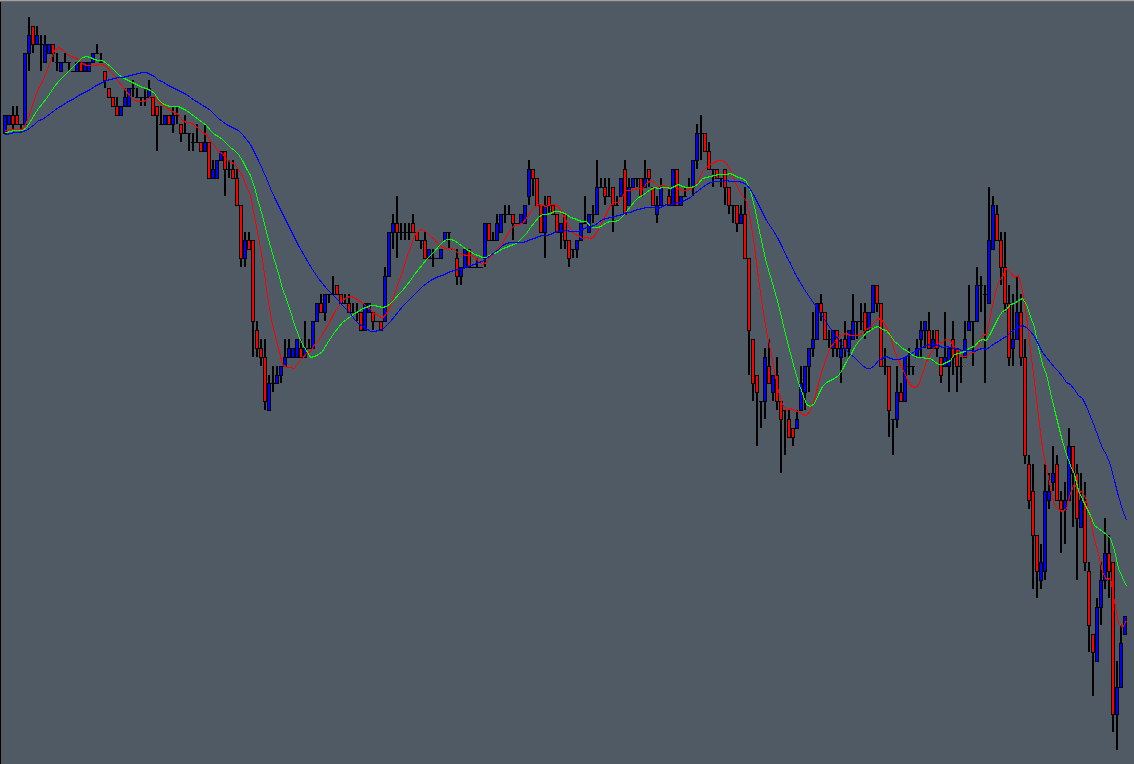
The POC (Point of Control) per Bar Moving Average Study monitors traded volume at price data and calculates the Volume Point of Control for each chart bar. In addition, up to 3 moving average can be applied to the point of control price, providing both an indication of point of control migration, and the average POC price over per moving average period.
calculates the Volume Point of Control for each chart bar…
Possible Uses
Whilst not directly analagous to the Volume Weighted Average Price, the moving average of the Point of Control can provide a useful gauge of POC migration or concentration over time, and potentially volume distribution over the short term.
A simple example being, if different length moving averages of POC price converge for extended periods, this can be indicative of high volume being concentrated within a narrow range, this area (or point) of convergence can potentially act as support or resistance in the short term.
convergence can potentially act as support or resistance…
A little bit more about the study
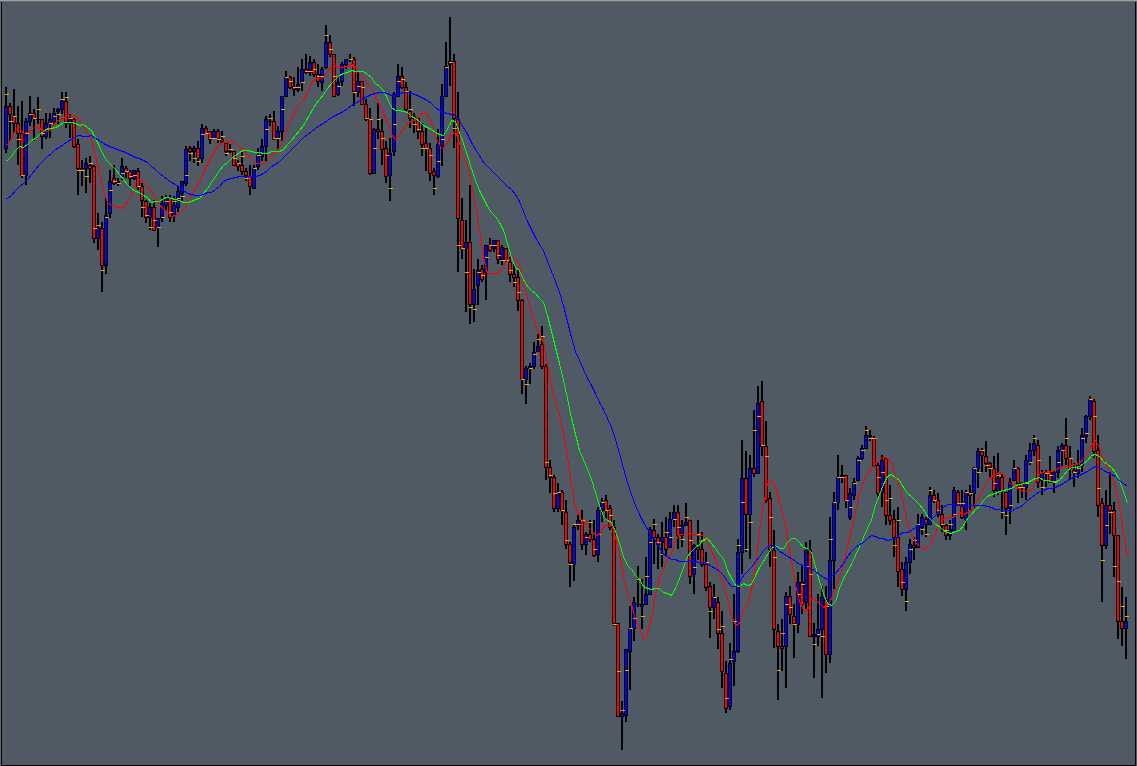
The study data is output via upto 4 subgraphs, enabling display of the POC for every chart bar, as well as up to 3 moving averages. The moving average types can be individually selected from the available standard moving average types within the Sierra Chart program.
0 Comments