Strength
Monitor relative strength of buyers vs. sellers
Charting
Choose from a selection of chart display options
Imbalance
Visualise supply & demand imbalances
The Basics
The Ask Bid Volume study tracks the total Ask and Bid volume traded per chart bar period, it can be used to monitor the relative strength of aggressive (market) buyers and sellers.
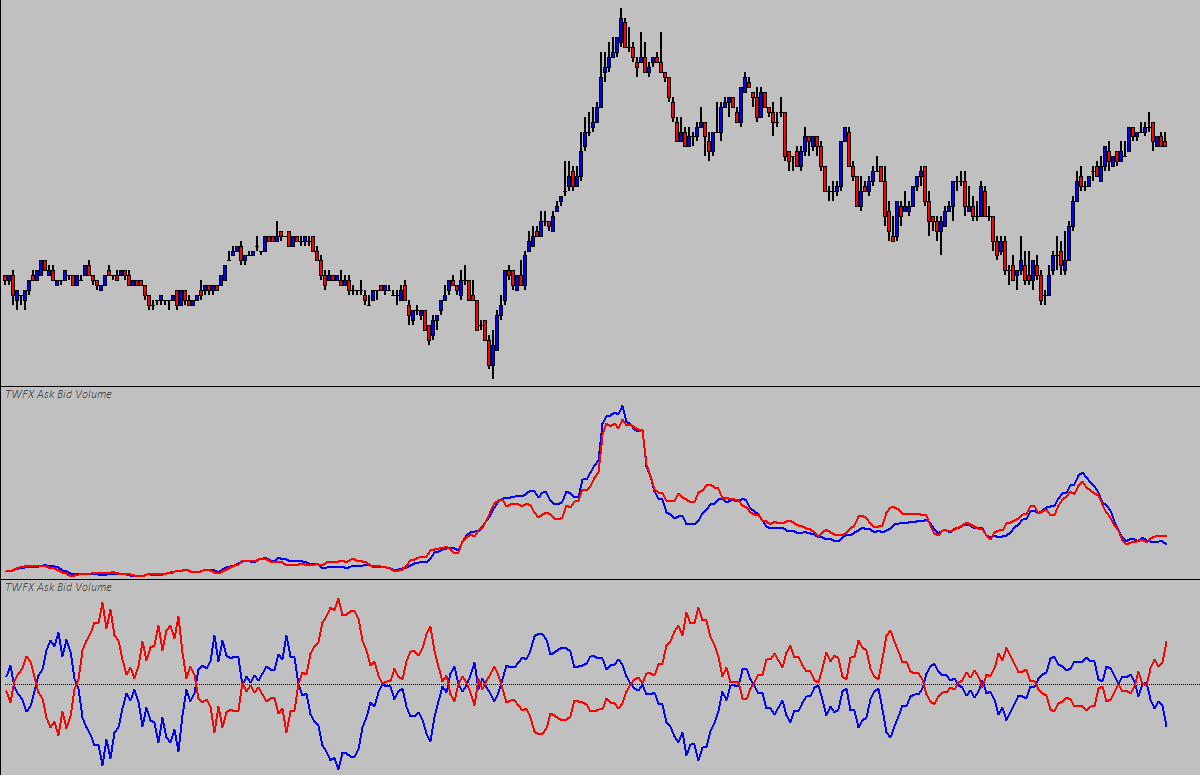
The most basic configuration of the study shows raw Ask and Bid volume data per chart bar period, and so presents a combined view of per bar volume and delta – the distance between the Ask and Bid volume lines being the per bar delta.
monitor the relative strength of aggressive buyers and sellers…
Possible Uses
A simple use case could be to gauge the commitment of market participants as price tests beyond structural levels, such as the prior day high / low or the initial balance high / low.
If price tests beyond a structural high, and there is an accompanying increase in both volume and delta (as indicated by the distance between the Ask and Bid Volume plots), but price does not continue higher, this can indicate that there is an excess of supply in the form of passive (limit) market participants.
gauge the commitment of market participants as price tests beyond structural levels…
A little bit more about the study
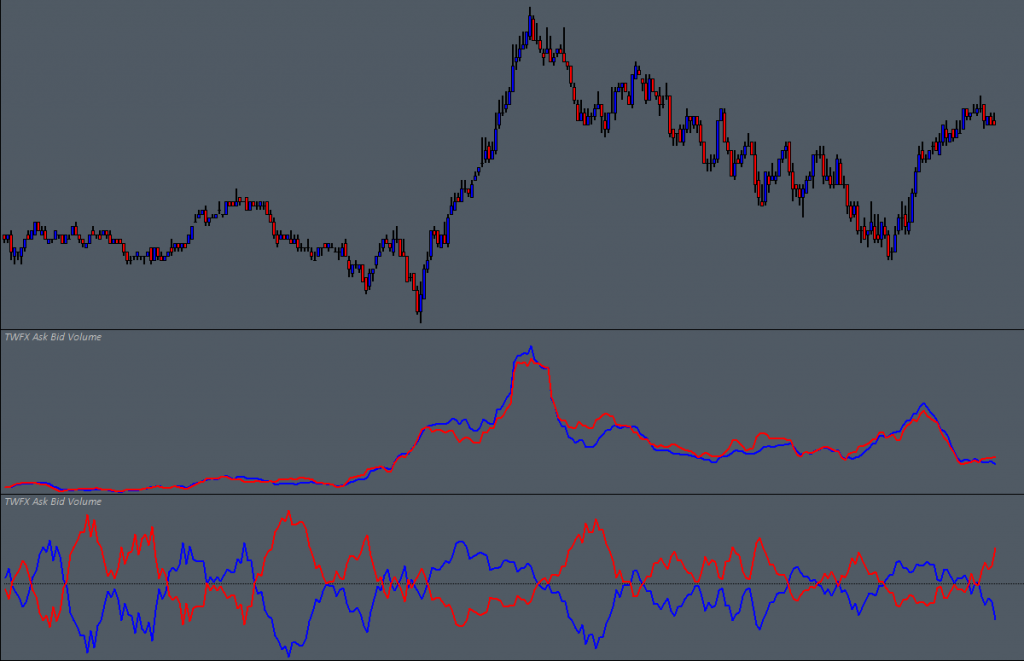
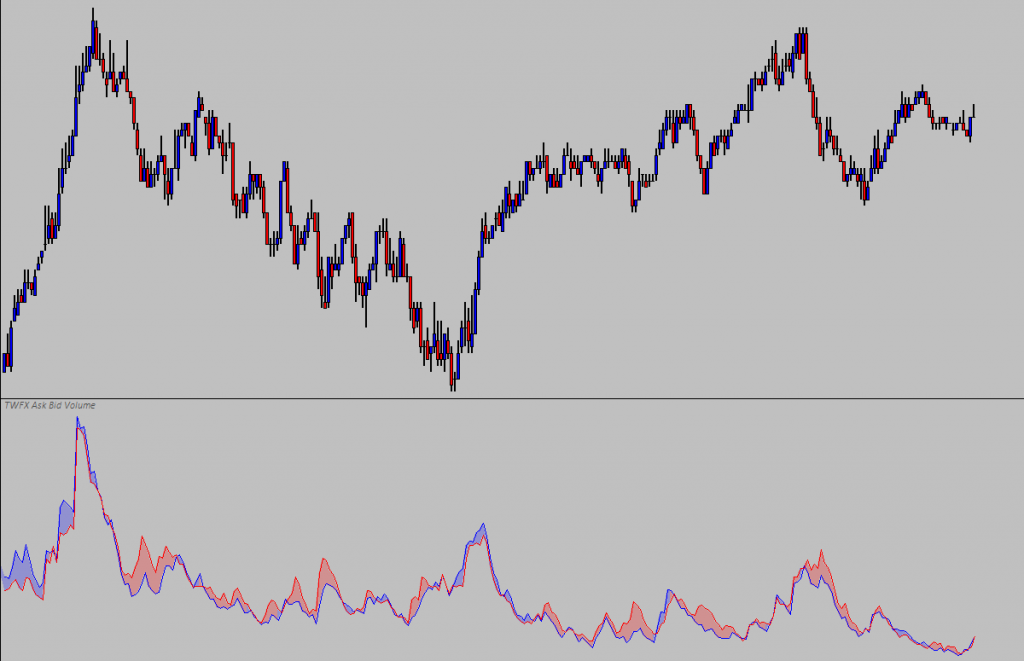
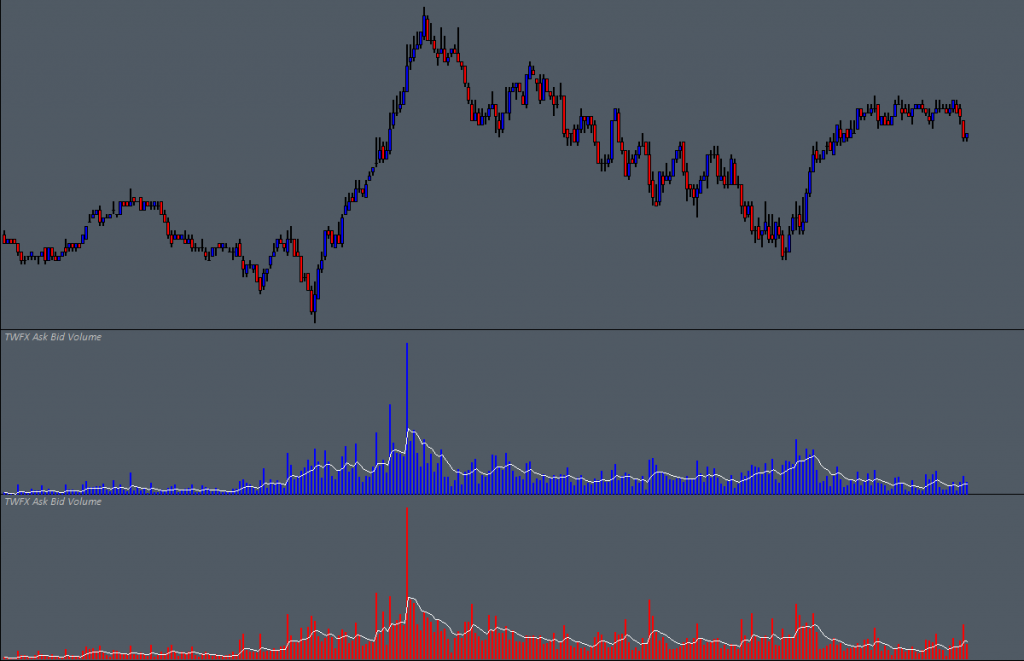
The Ask Bid Volume study provides various configuration options, allowing the volume data to be presented in a number of different ways, depending the intended use.
Volume data can be shown either as actual Ask and Bid volume or Ask and Bid volume as a percentage of the total volume. It is possible to show the raw data per bar, or to use either moving average or cumulative volume if a trend based view is preferred.
data to be presented in a number of different ways…


0 Comments