Strength
Monitor trends in strength of buyers and sellers
Calculation Mode
Choose from day, session or rolling cumulative sum
Divergence
Identify divergence between price and cumulative delta
The Basics
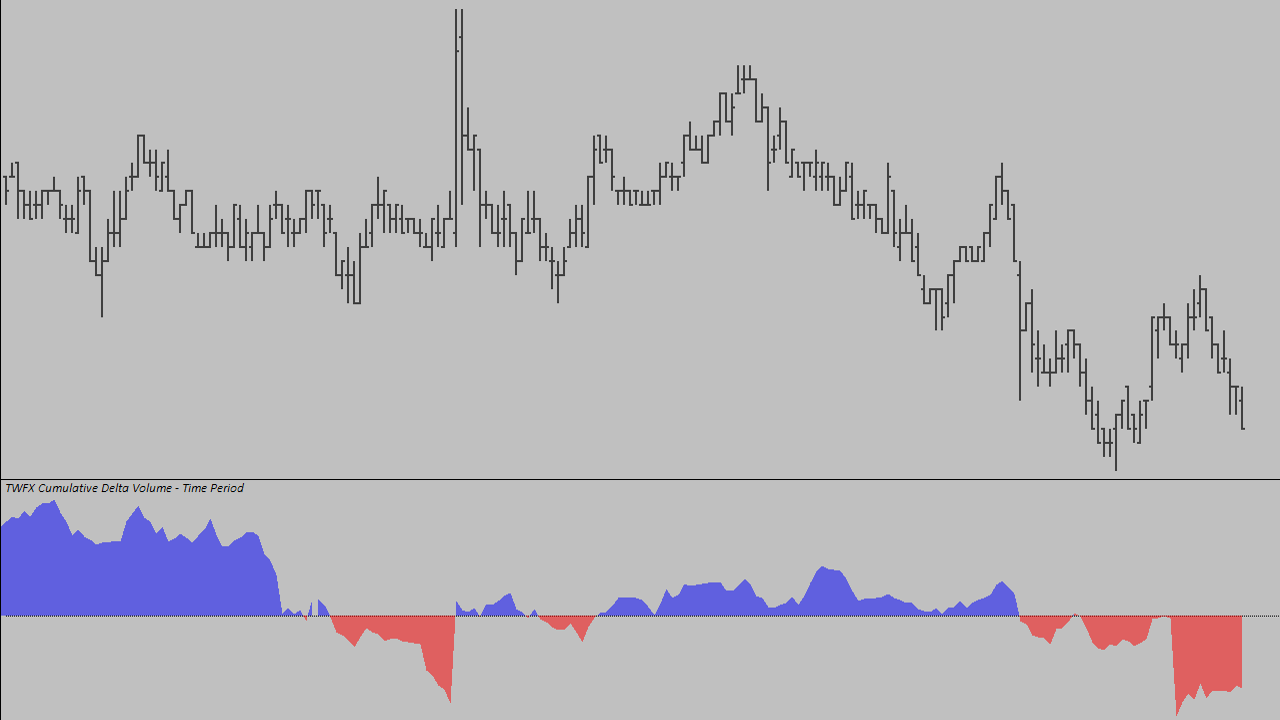
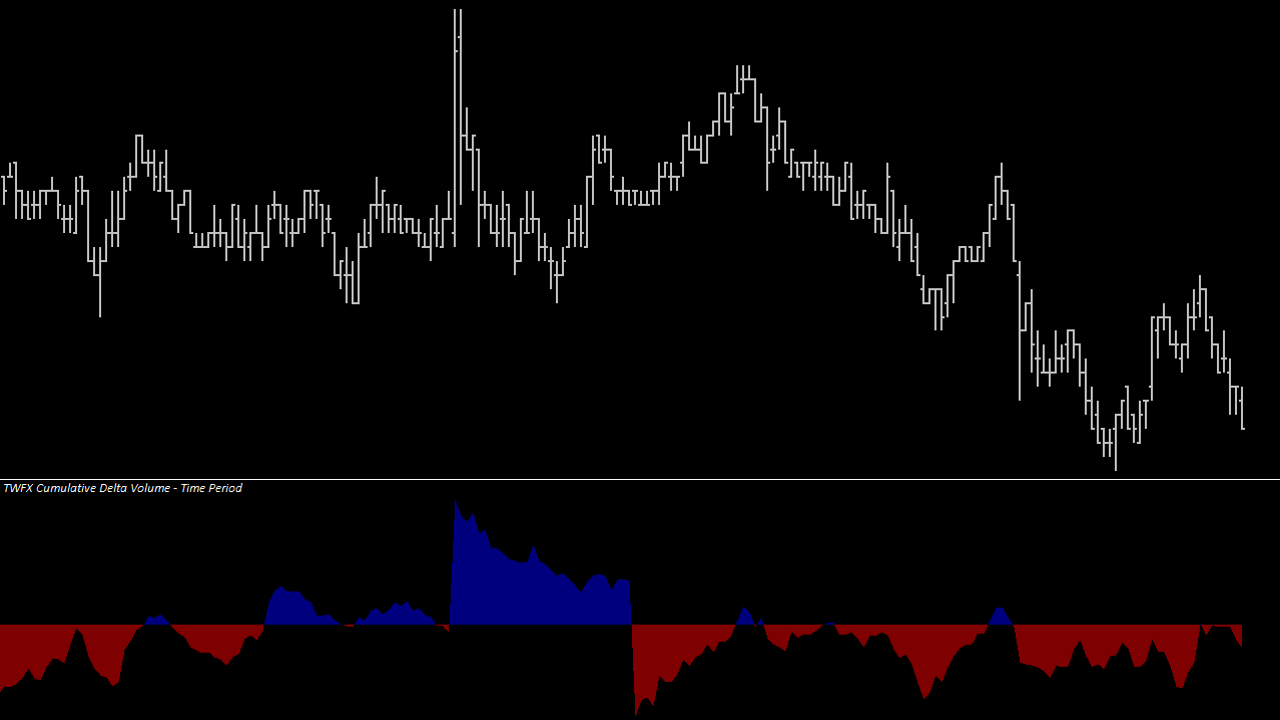
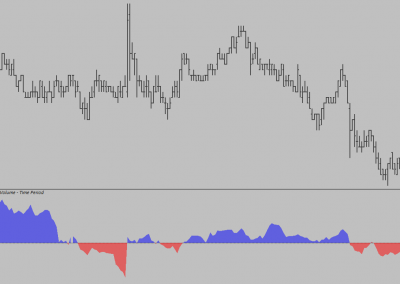
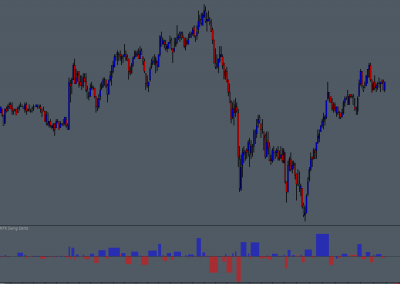
The Cumulative Delta – Time Period study tracks and accumulates the difference (Delta) between the Ask and Bid volume traded per chart bar period. it can be used to monitor the relative strength of aggressive (market) buyers and sellers, and trends in behaviour.
The standard configuration of the study displays the accumulated Delta volume for the trading day (or session) and is reset at the beginning of each trading day (or optionally session).
monitor the relative strength of aggressive buyers and sellers…
Possible Uses
A possible use case could be to monitor cumulative delta and use in conjunction with other methods / studies to qualify trade entry (or exit) locations.
If price is trending downwards towards an area that has been identified through other means as being a potential buying location, does the cumulative delta confirm that a change towards increased aggressive buying is taking place, either through reduced selling, increased buying, or both?
qualify trade entry locations…
A little bit more about the study
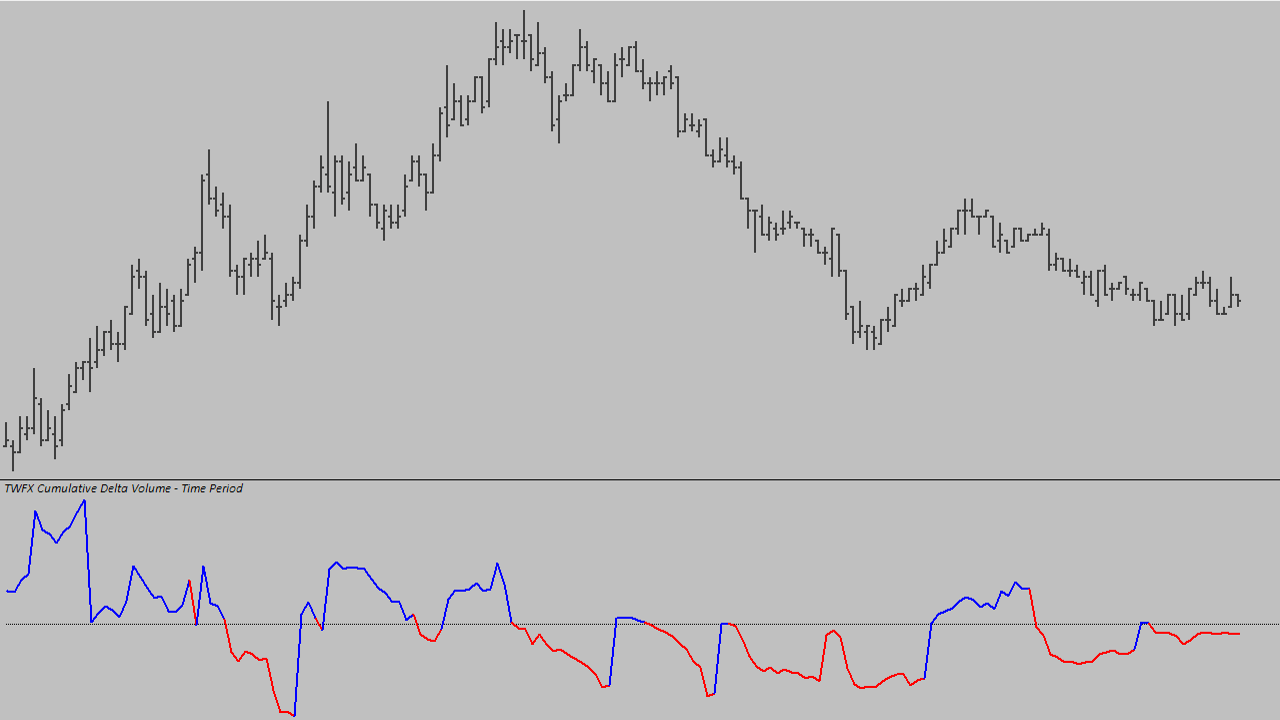
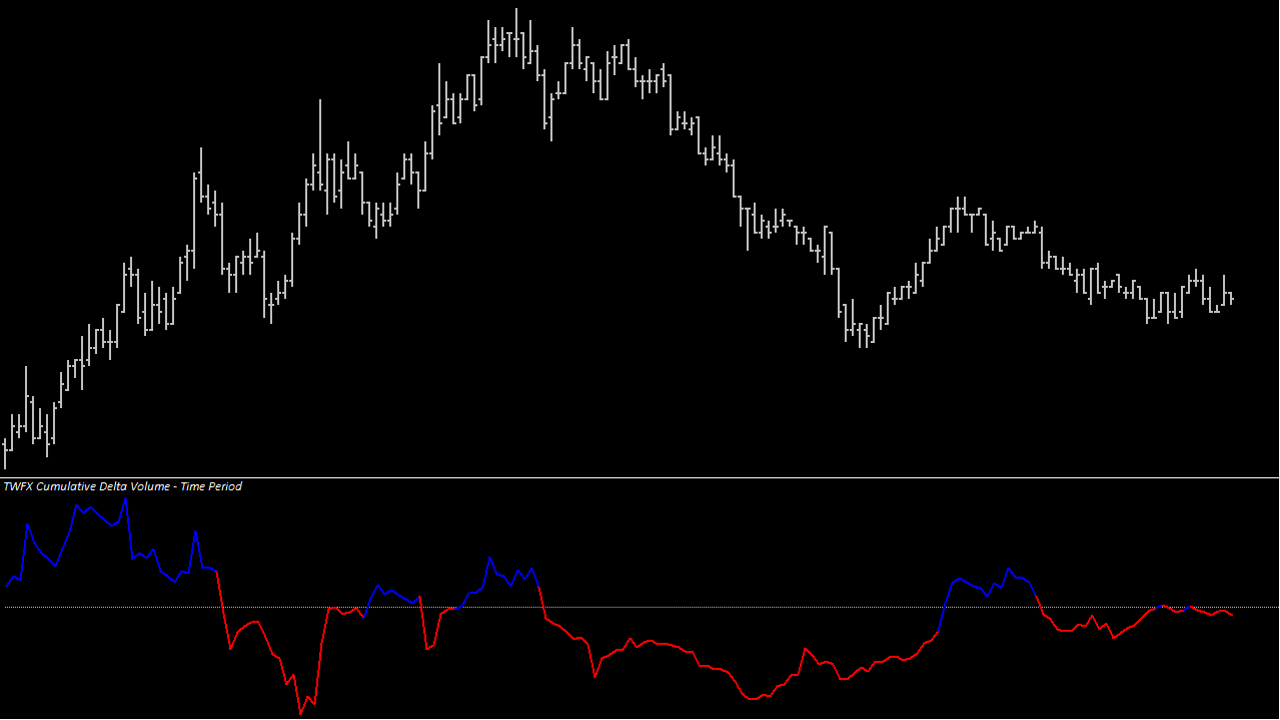
In addition to the standard calculation mode, the Cumulative Delta – Time Period study provides additonal time based calculation modes, which are based on either: Rolling Cumulative Delta sum per accumulation time period; or a Cumulative Delta sum per fixed accumulation period.
The additional calculation modes give the option to view cumulative delta over a shorter time period and can make it easier to identify short term divergence between delta and price. Short term divergences and/or changes in delta trends can be difficult to see if the initial change in delta is small compared to the accumulated delta for the day or session.
identify short term divergence between delta and price…

Amazing! I love it