
Volume
Expose volume at price data to subgraphs, enabling additional analysis
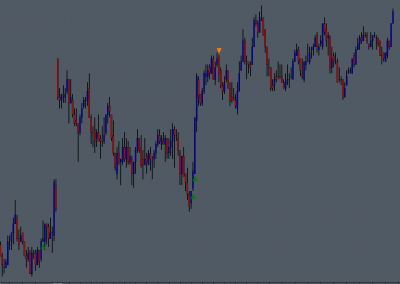
Alerts
Use the study subgraph data as the basis for buidling orderflow based alerts
The Basics
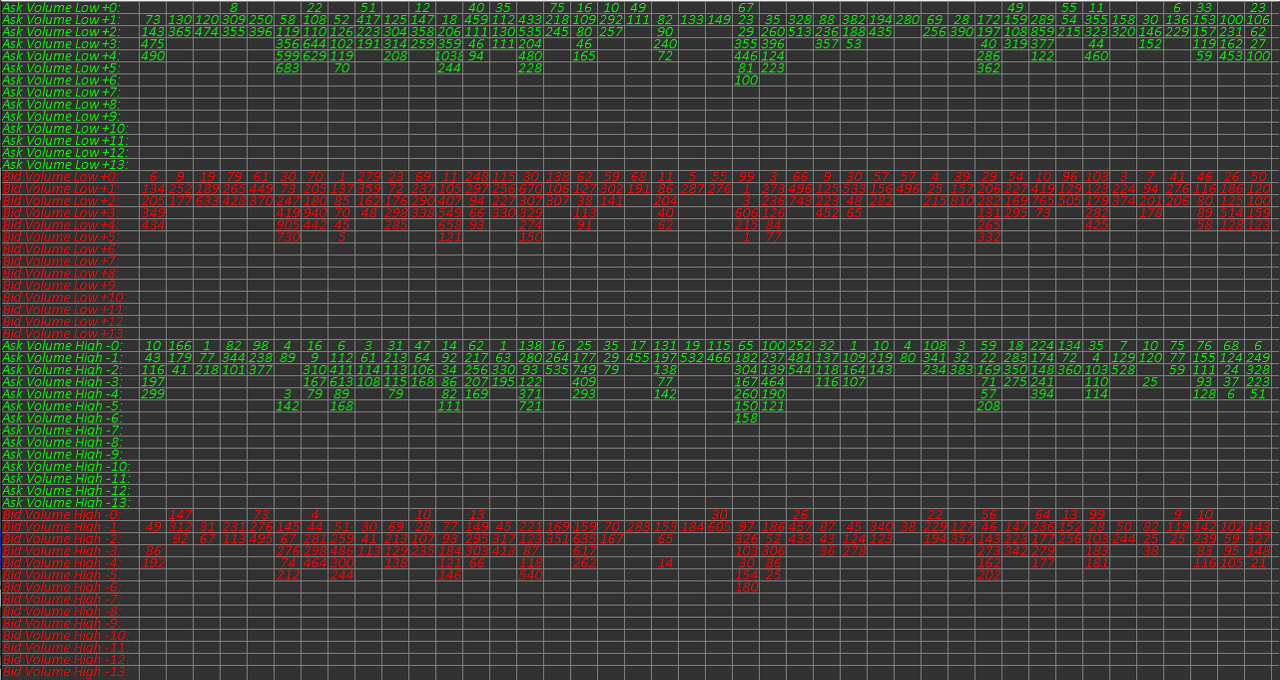
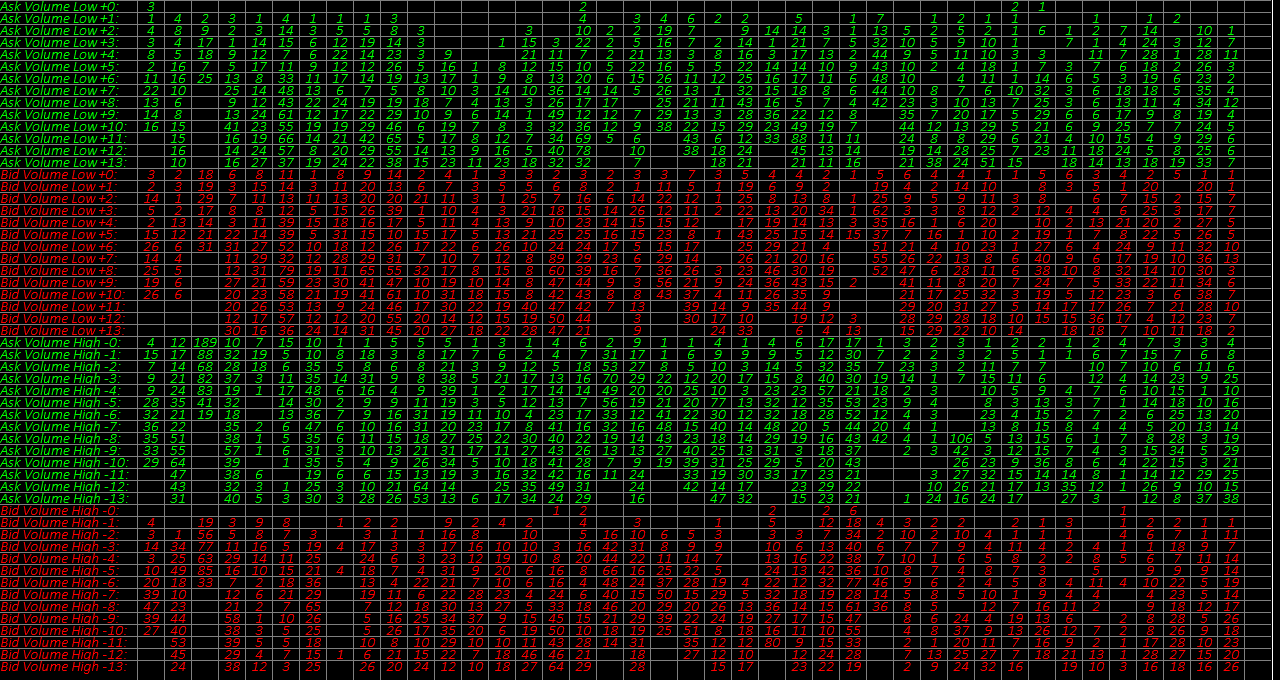
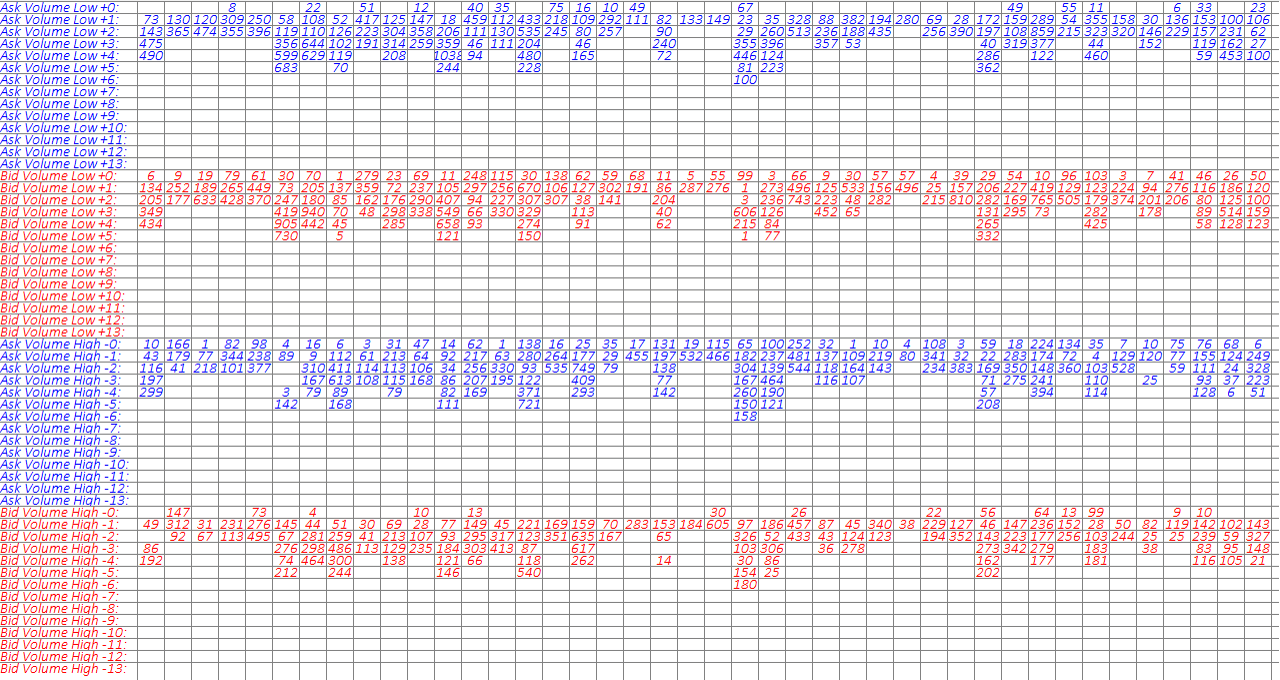
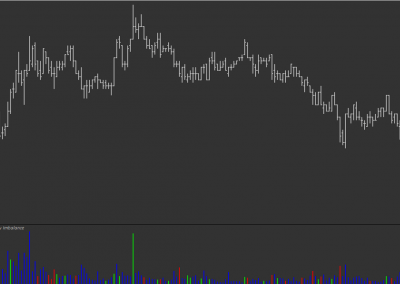
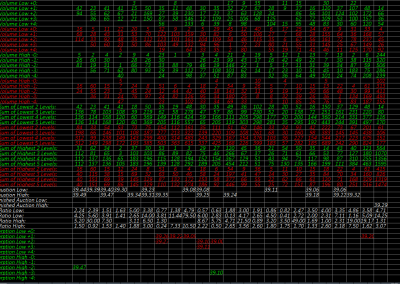
The Volume at Price for Bars study monitors and records the traded volume at the lowest and highest price levels (upto 14) for each chart bar.
The recorded data is output via subgraphs, enabling both the creation of alerts based on volume at price data, and additional analysis of volume at price data.
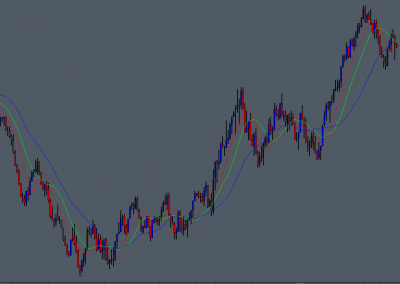
Output subgraph data can be displayed in numeric table format, in place of, or in addtion to the main price graph.
alerts based on volume at price data…
A little bit more about the study
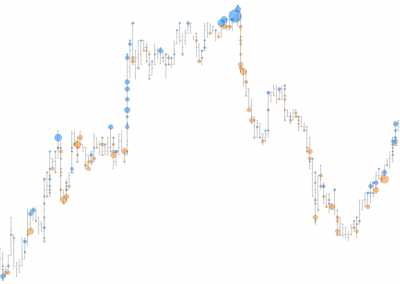
The Volume at Price for Bars study utilises upto 57 subgraphs to provide simple access to volume at price data, as seen when using the numbers bars study.
Options are provided to allow filtereing based on bar volume and range conditions, and to simplfiy color settings.
When used in conjunction with the built in Sierra Chart alert studies (e.g. Color Bar Based on Alert Condition), alerts can easily be configured based on specific volume at price conditions.
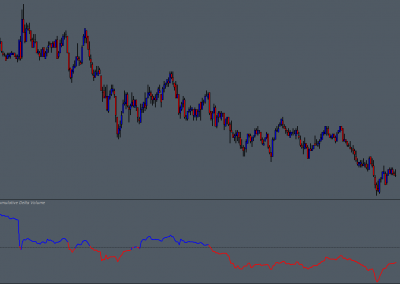
It is also possible to access the volume at price subgraph data using the Sierra Chart spreadsheet functionality, this allows for more advanced analysis.
0 Comments