
Orderflow
Easily identify areas of high activity, visualize orderflow
Display Options
Choose from a selection of study display options
Trade Ideas
Market generated information to help qualify trade ideas
The Basics
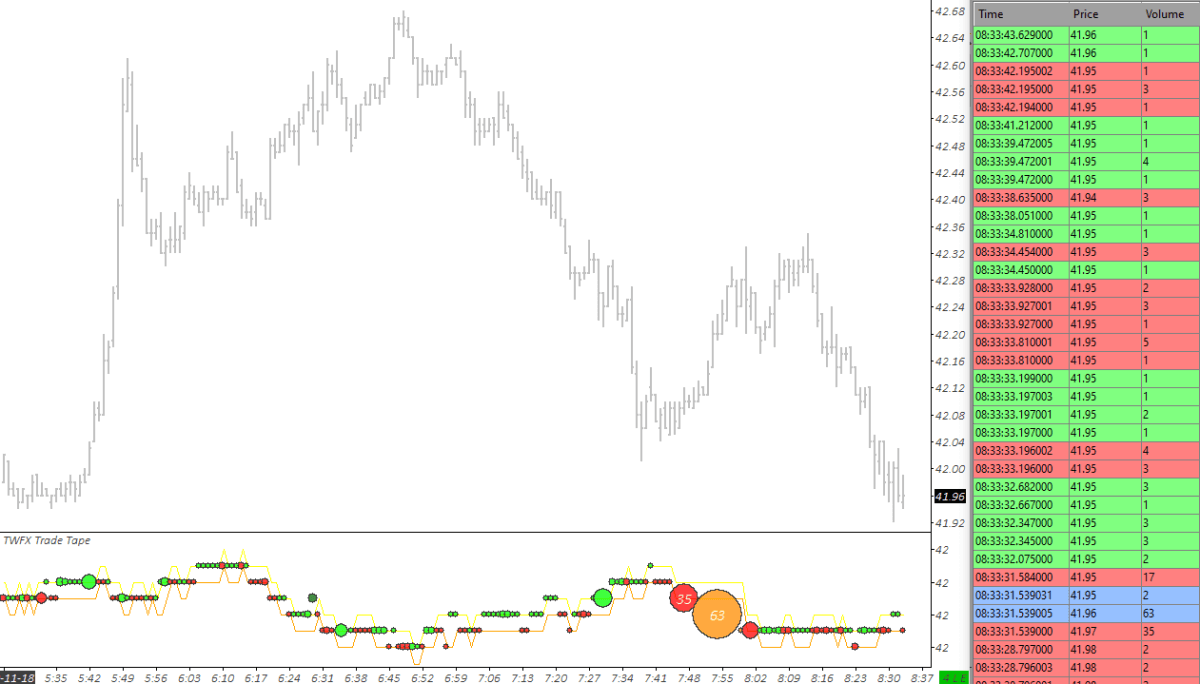
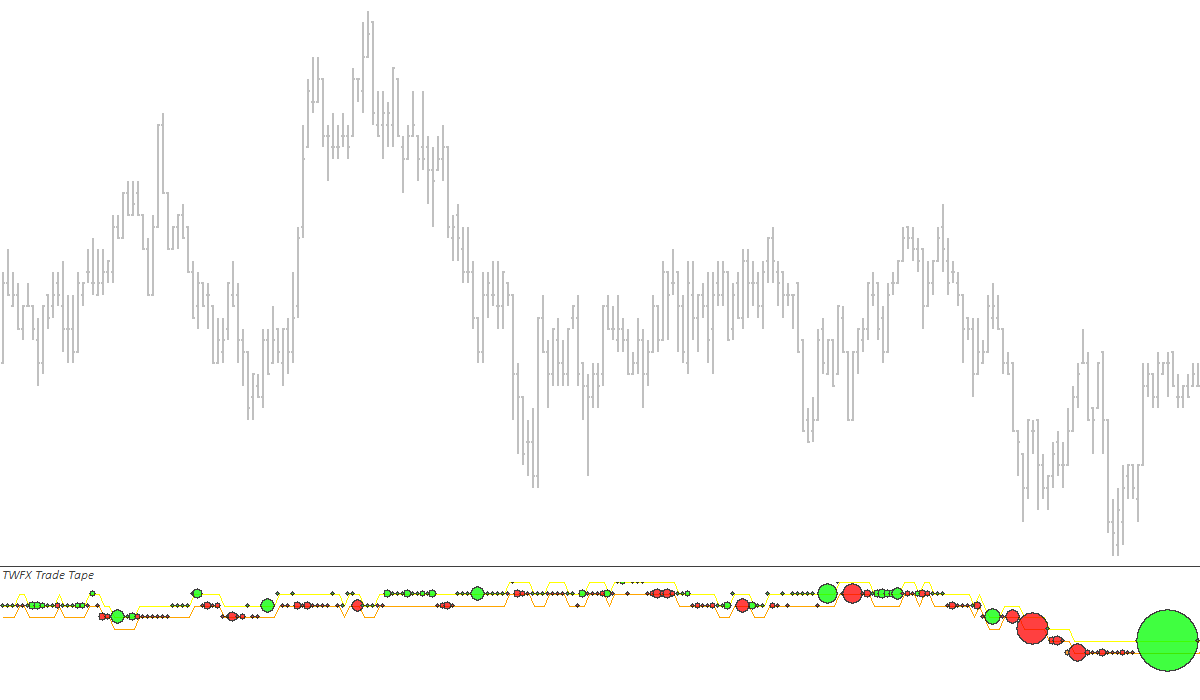
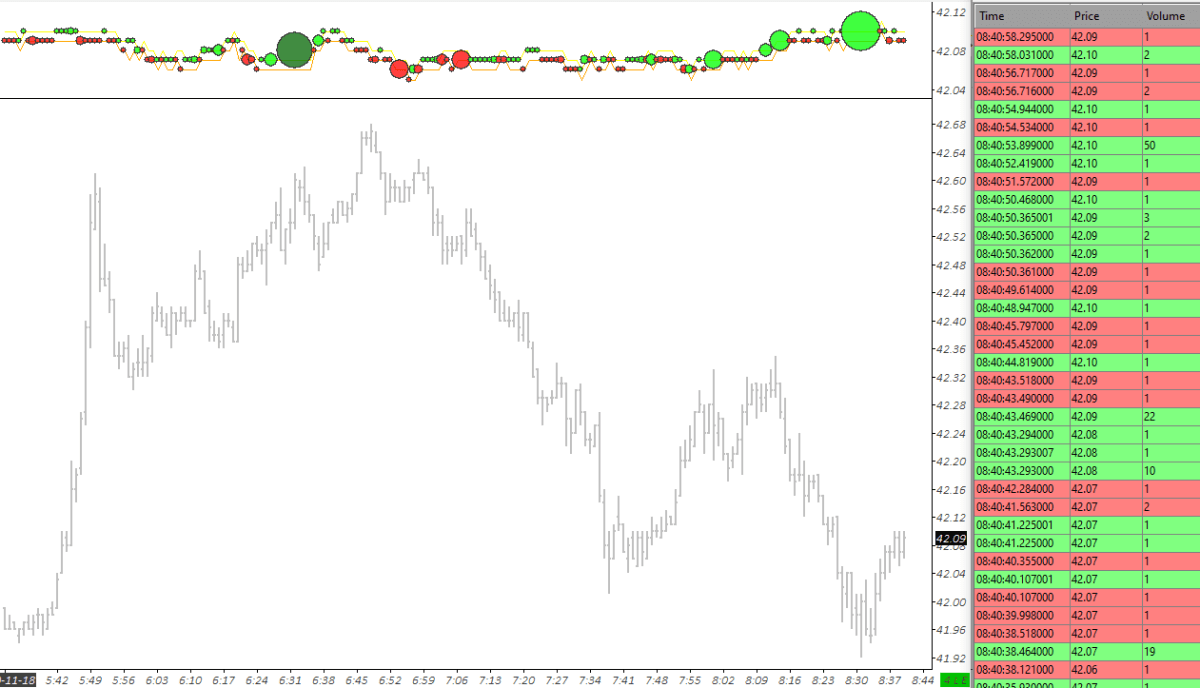
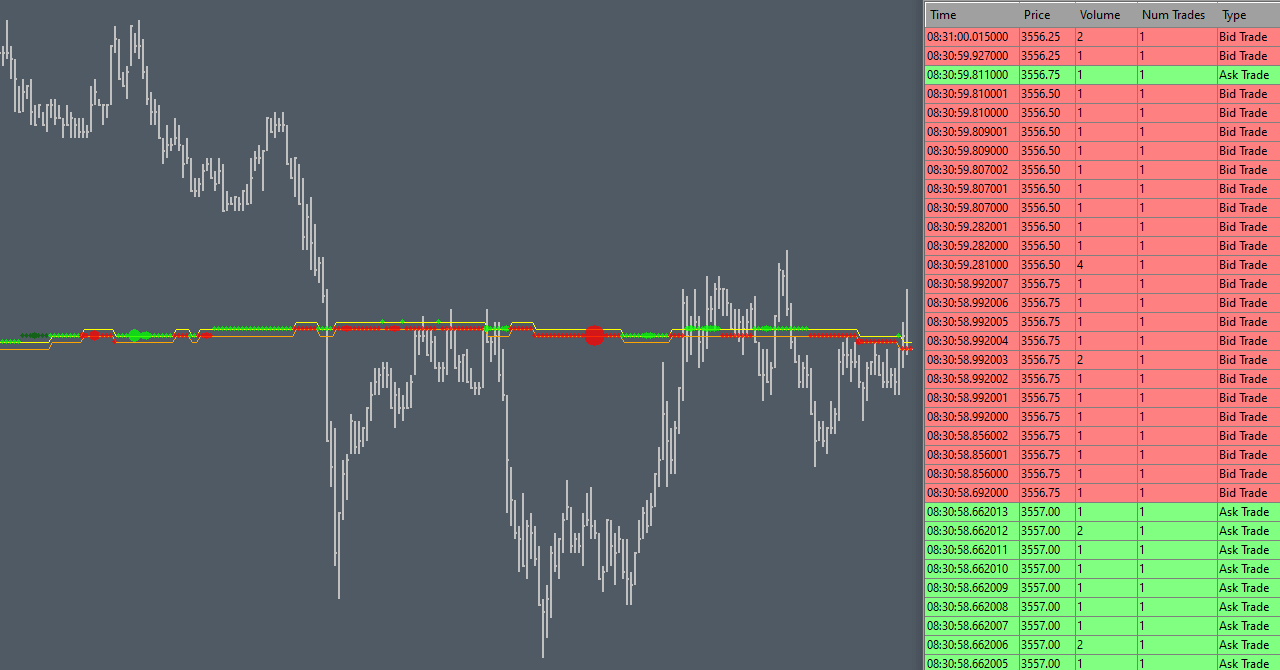
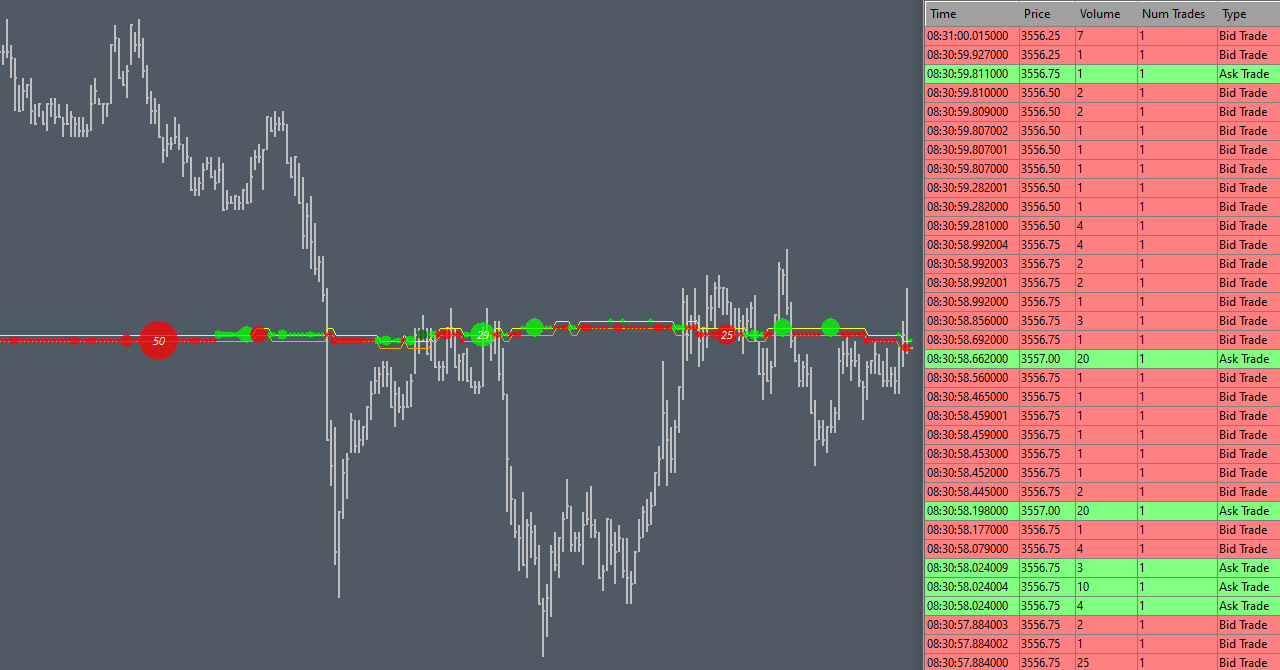
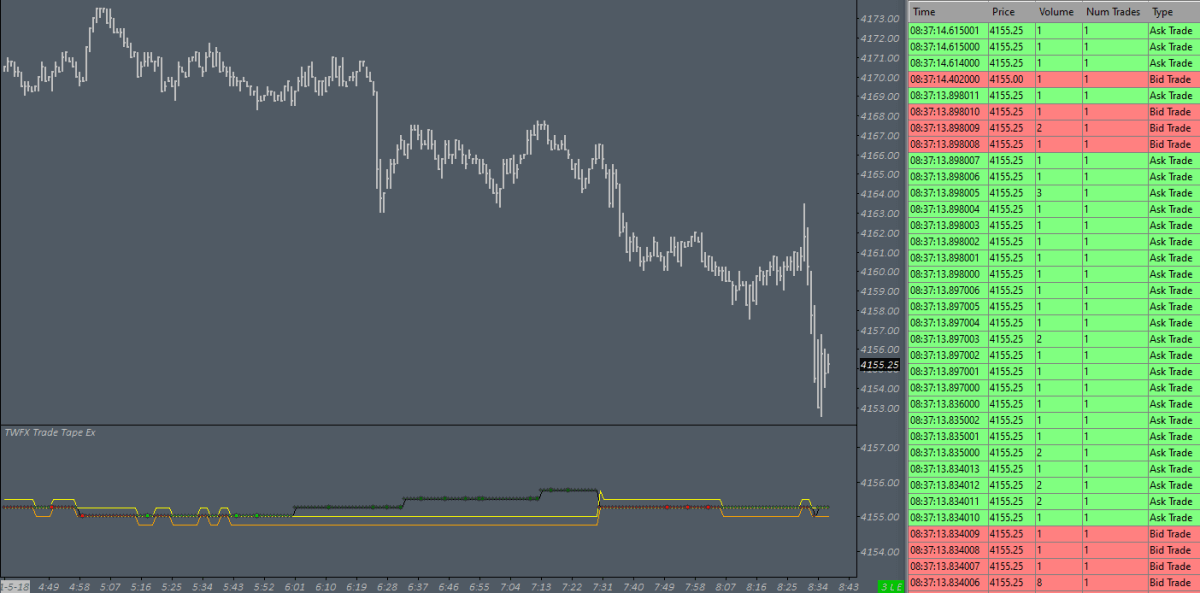
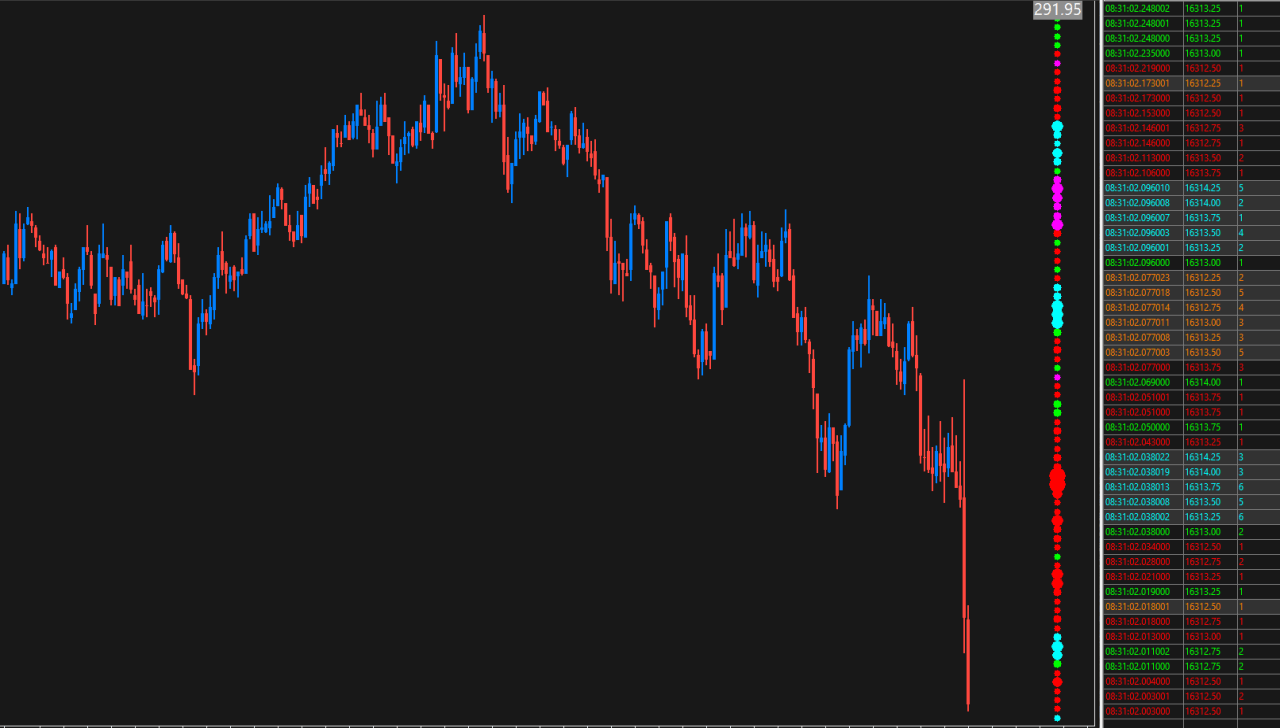
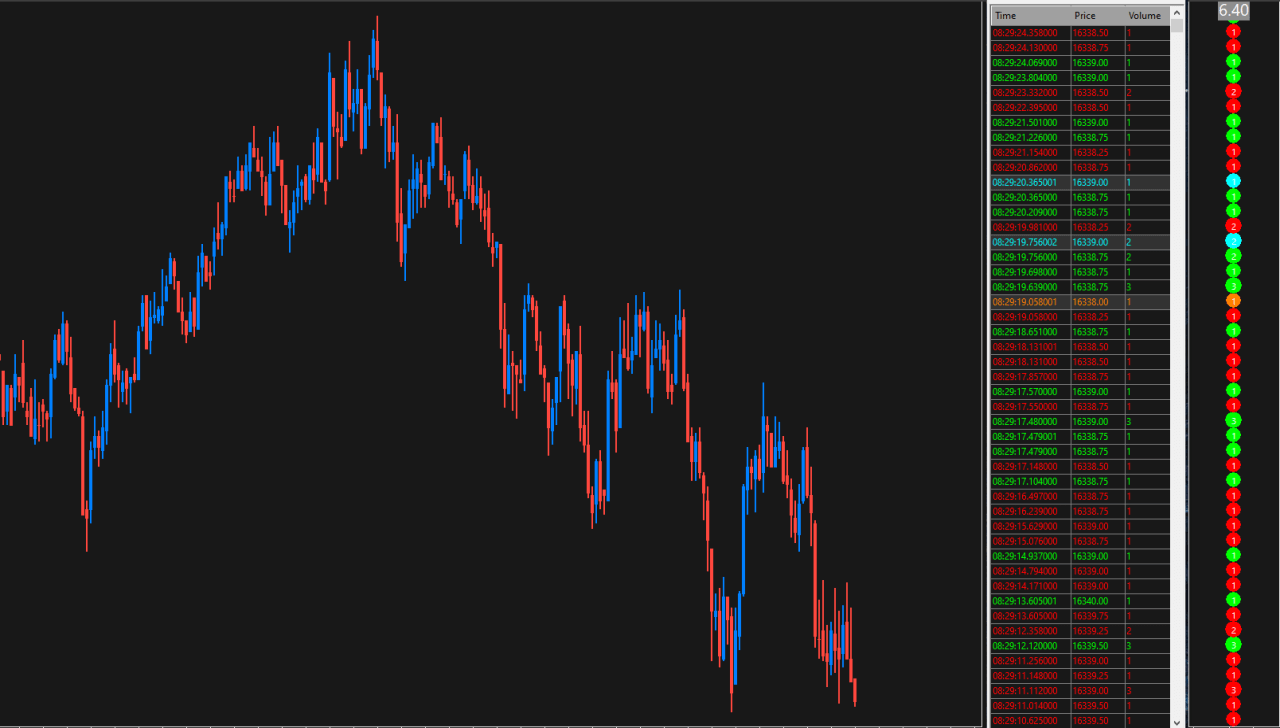
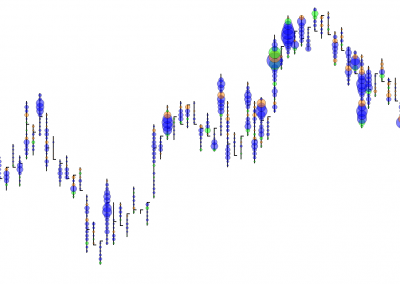
The Trade Tape study monitors time & sales data and provides a selection of different configuration and display options, including: Several methods for combining individual limit orders to show (or approximate) market orders; Trade Dot and/or Text display; Trade Slippage; and variable sizing and/or coloring options for trade dot display.
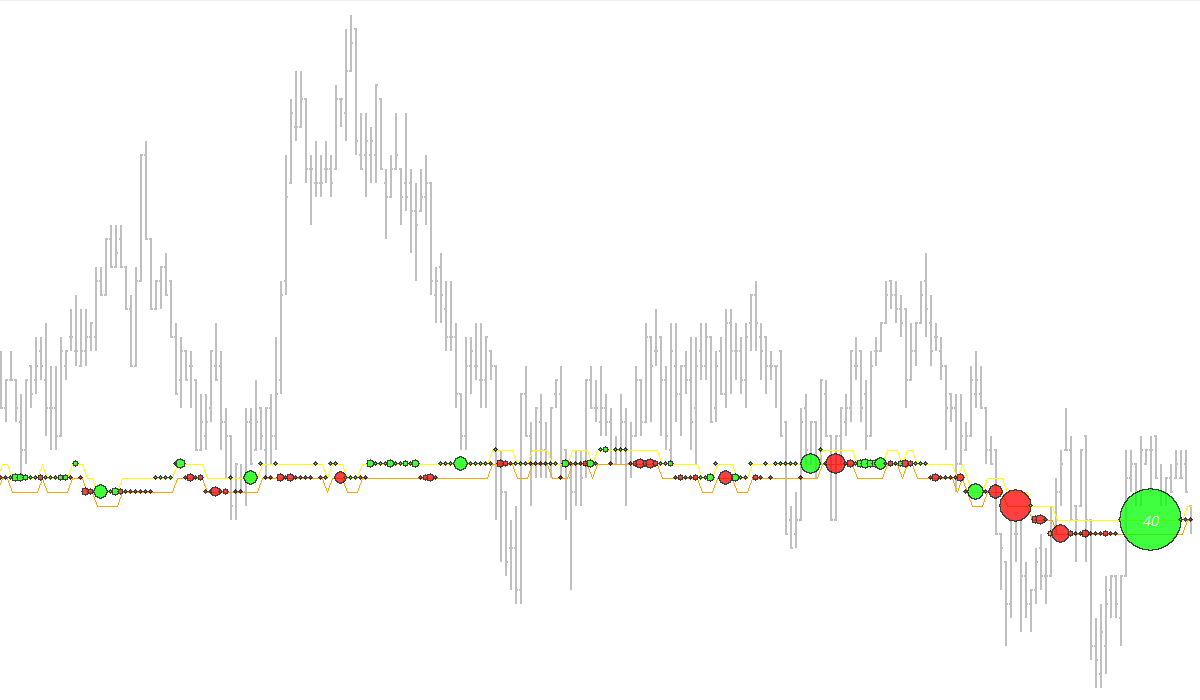
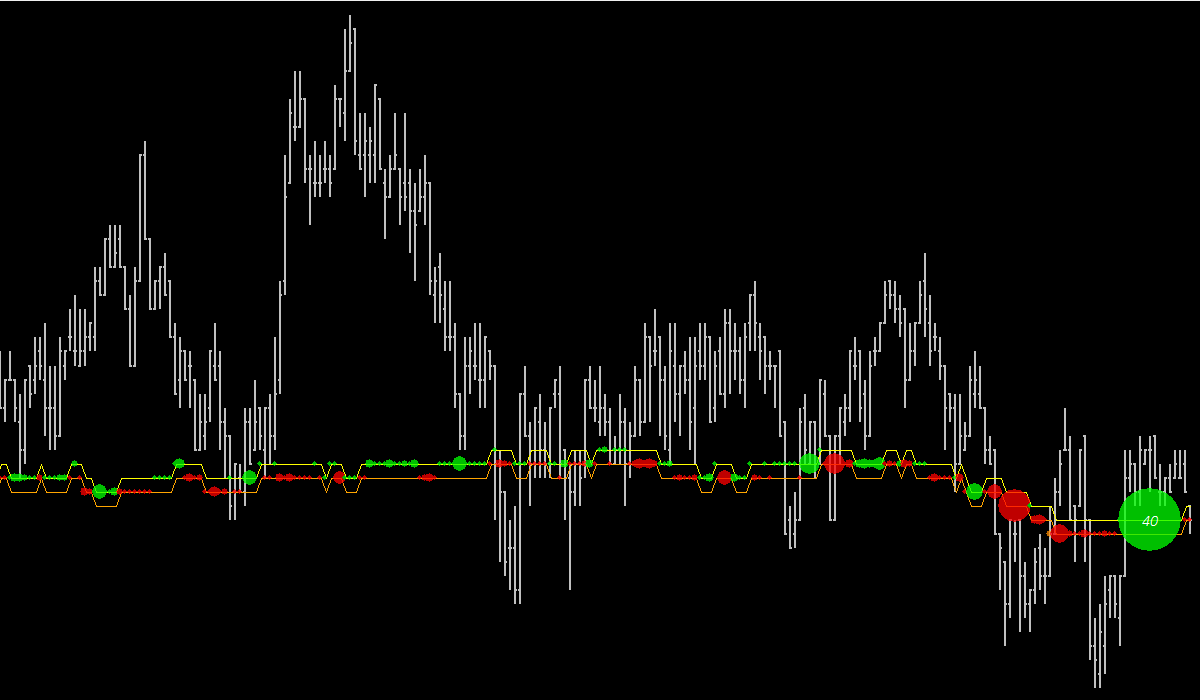
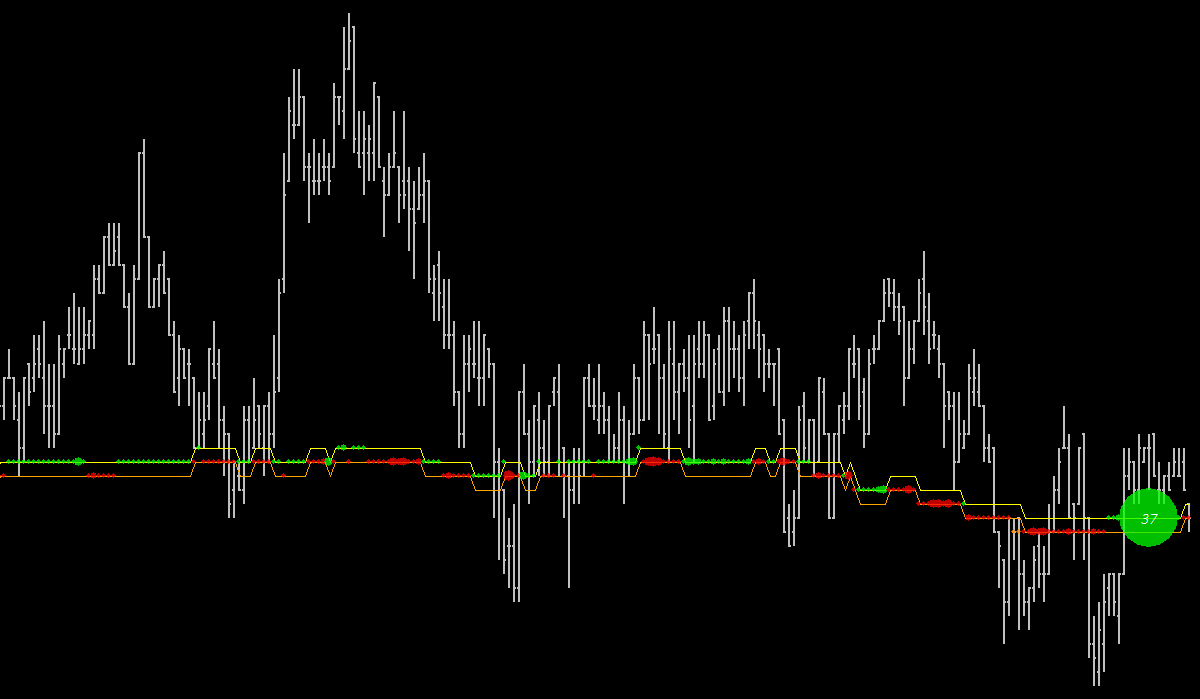
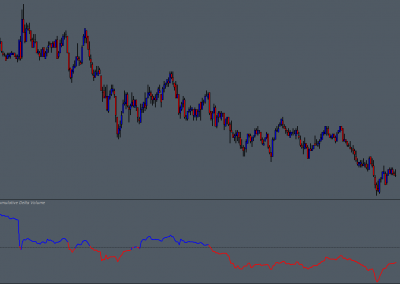
The size, volume and frequency of trades can be visualized and quickly evaluated, directly from the chart. This can help to determine whether one side of the market is dominant, or if a change in orderflow is taking place. The dot visualization can also help with the identification of absorption at price levels.
size, volume and frequency of trades can be visualized and quickly evaluated…
Possible Uses
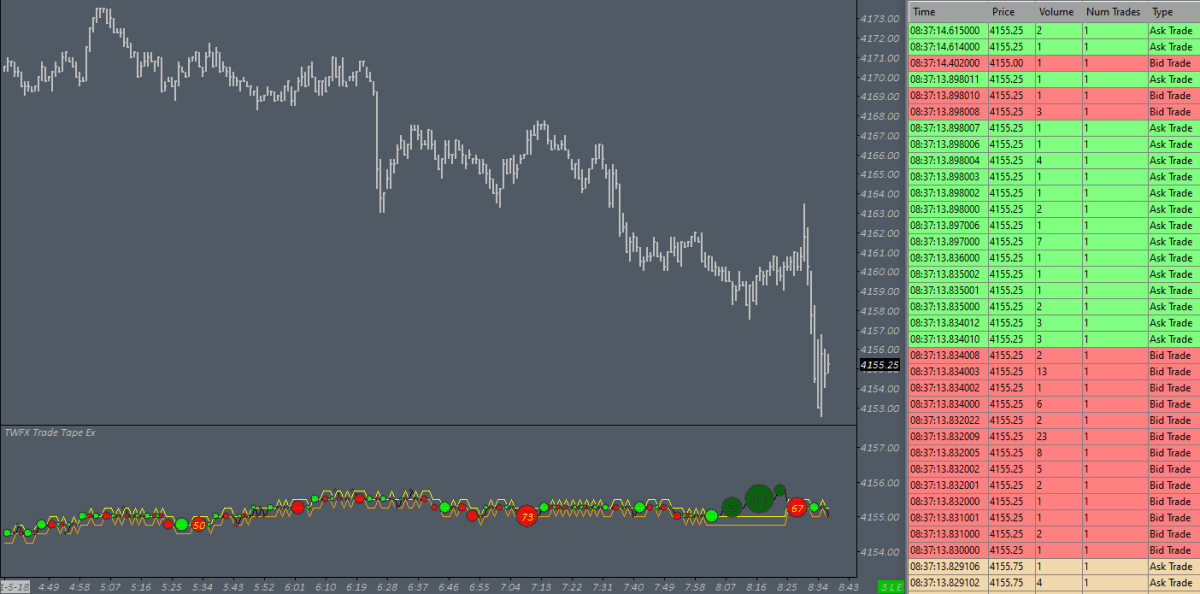
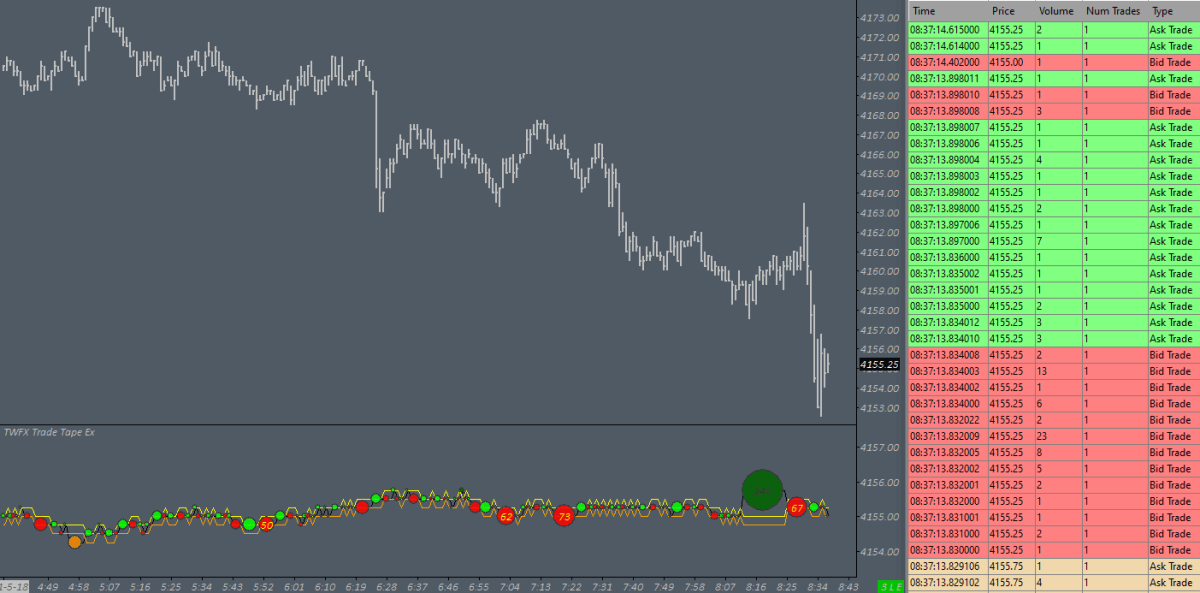
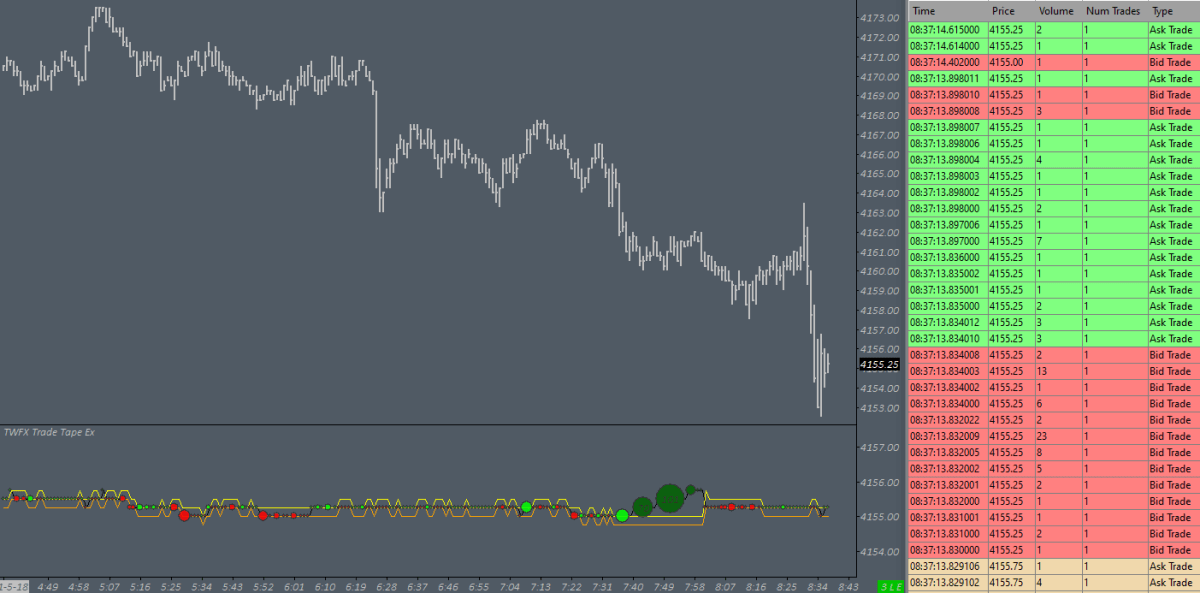
The study has a number of different uses, for example it could be used in to help identify areas where larger aggressive market participants are active, or area where high volumes of trade are taking place but price be does not move beyond – indicating possible abosprtion by passive (limit order) participants.
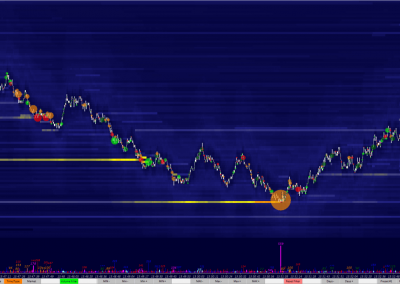
Areas of increased aggressive buying and selling can quickly and easily be indentified, which, in combination with other methods, may provide information that can be used to help qualify entry or exit conditions.
Display the trade tape study as a subgraph below (or above) the main price chart, or overlaid directly onto the price chart so that trade activity at price levels is easiliy identifed in relation to price action.
increased aggressive buying and selling can quickly and easily be indentified…
Some More About the Study
The study provides options to control how the time and sales data is processed prior to being displayed on the chart, these modes are explained below and in the study documentation – Trade Tape Study. In addition to the data processing options available, configuration options are provided to control volume filtering, trade dot size, trade dot color and color intensity, text color, and more.
There are four data processing modes available, affecting how the time and sales data is displayed on the chart: ‘Do Not Combine’; ‘Same Time and Price’; ‘Same Time and Type’; and ‘Combine into Exchange Reported Summary Trade’.
Do Not Combine
Same Time and Price
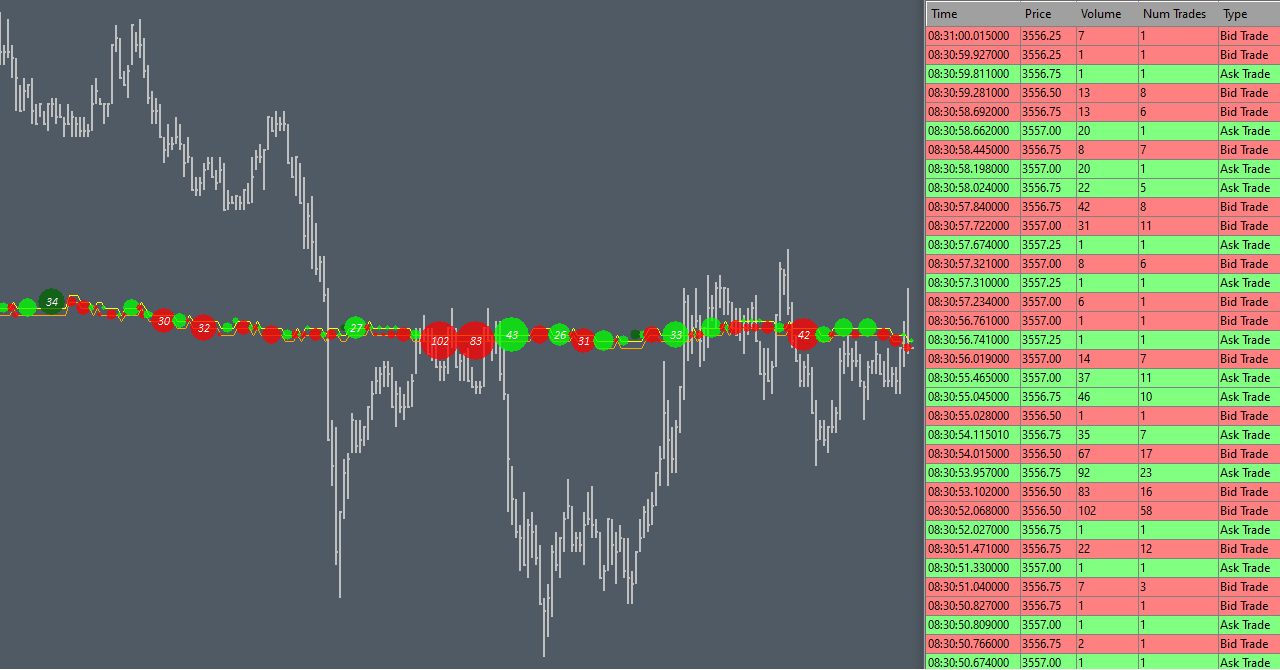
Same Time and Type
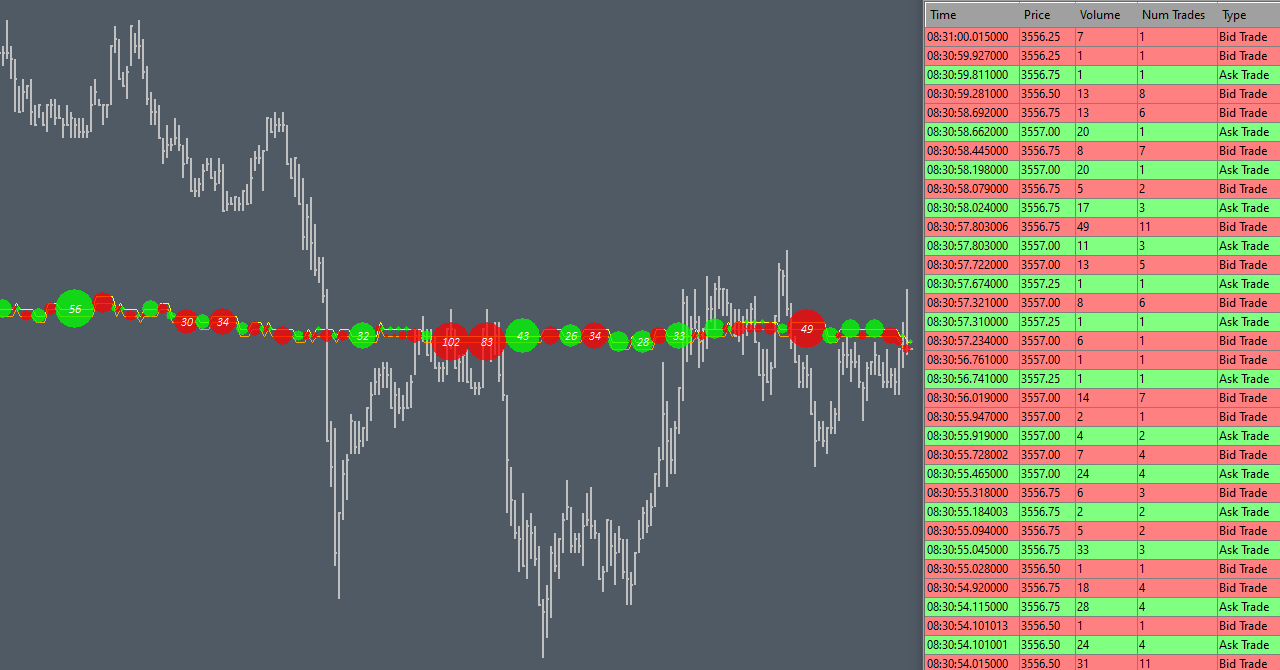
Combine into Exchange Reported Summary Trade
This mode applies to CME and EUREX symbols and only when using the Sierra Chart Denali feed.
Trade dot size has three configuration options; ‘Relative Volume’; ‘Small and Large’; and ‘Fixed Size Range’, all of which use a configurable minimum and maximum size. The difference bewteen the sizing modes is simply the method used to calculate the dot size. The calculation methods used when determining the trade dot size are explained in the study documentation – Trade Tape Study.
Variable color intensity can be used to highlight trades with the highest volume, separate colors are also available to highlight slipped trades, which can be either stop orders being triggered or larger market orders transacting across multiple price levels.
options are provided to control volume filtering, trade dot size, trade dot color and color intensity, text color, and more…

Update
The Trade Tape study now includes a new study, ‘Trade Tape Ex’, an extended / enhanced version of the existing study. This new study study provides additional configuration options for controlling volume filtering, dot display position mode, dot display spacing, and slippage volume text. A new time and sales data processing option is also provided by the new study, ‘Market Order’ mode, all of the configuration options are explained in the the study documentation – Trade Tape Ex Study.
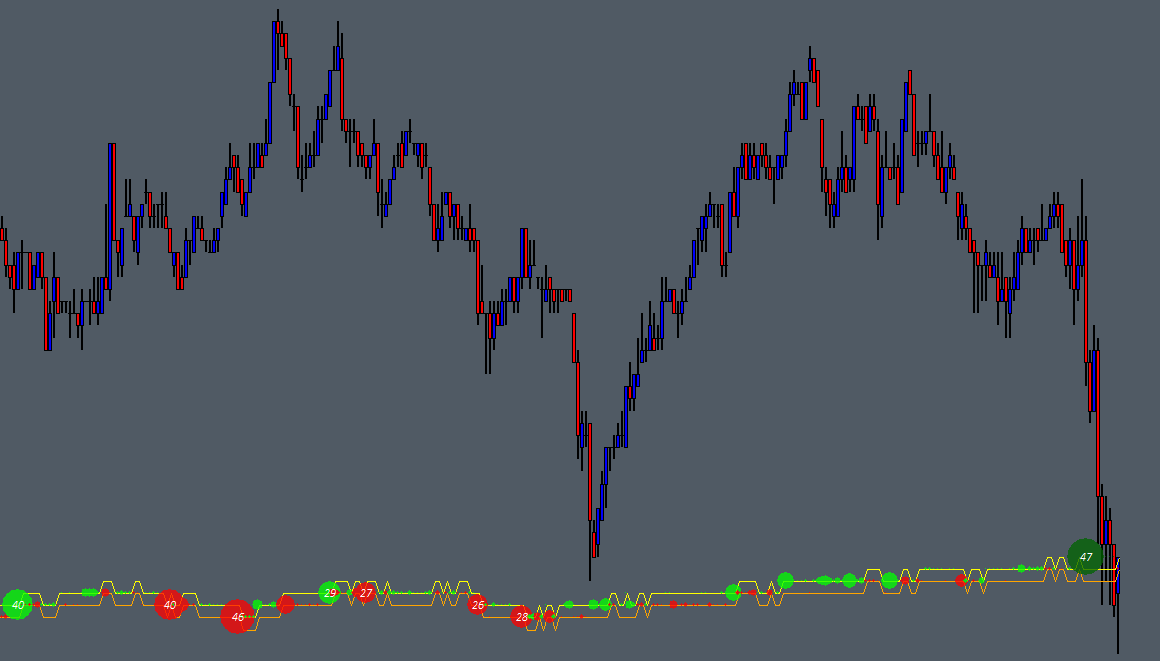
Do Not Combine
Same Time and Price
Same Time and Type
Combine into Exchange Reported Summary Trade
This mode applies to CME and EUREX symbols and only when using the Sierra Chart Denali data feed.
Market Order
This mode is equivalent to ‘Combine into Exchange Reported Summary Trade’ with the added feature of combining trades across price levels.
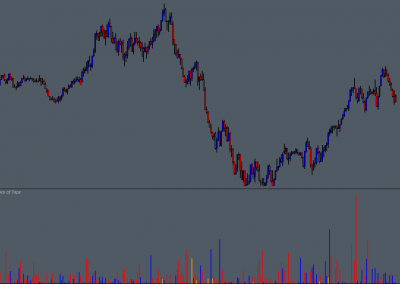
Update – Vertical Tape
A new version of the Trade Tape has been added to the study package, ‘Trade Tape Vertical’, this new study includes many of the features of ‘Trade Tape Ex’ but displays trade markers as a vertically scrolling tape rather than horizontal.
The vertical tape could be use in conjunction with, or even in place of the traditional time & sales window, add the study and set the display position to anywhere across the chart window. Compared to the other trade tape studies, displaying the tape vertically can keep the important data in a narrower focus area.
Another new feature, which is specific to the vertical tape, is the ‘Pace of Tape’ text display, this gives a quickly discernible and quantifiable read of the rate at which orders are transacting based on only the most recent order data.
The study documentation explains all of the configuration options – Trade Tape Vertical Study.
0 Comments