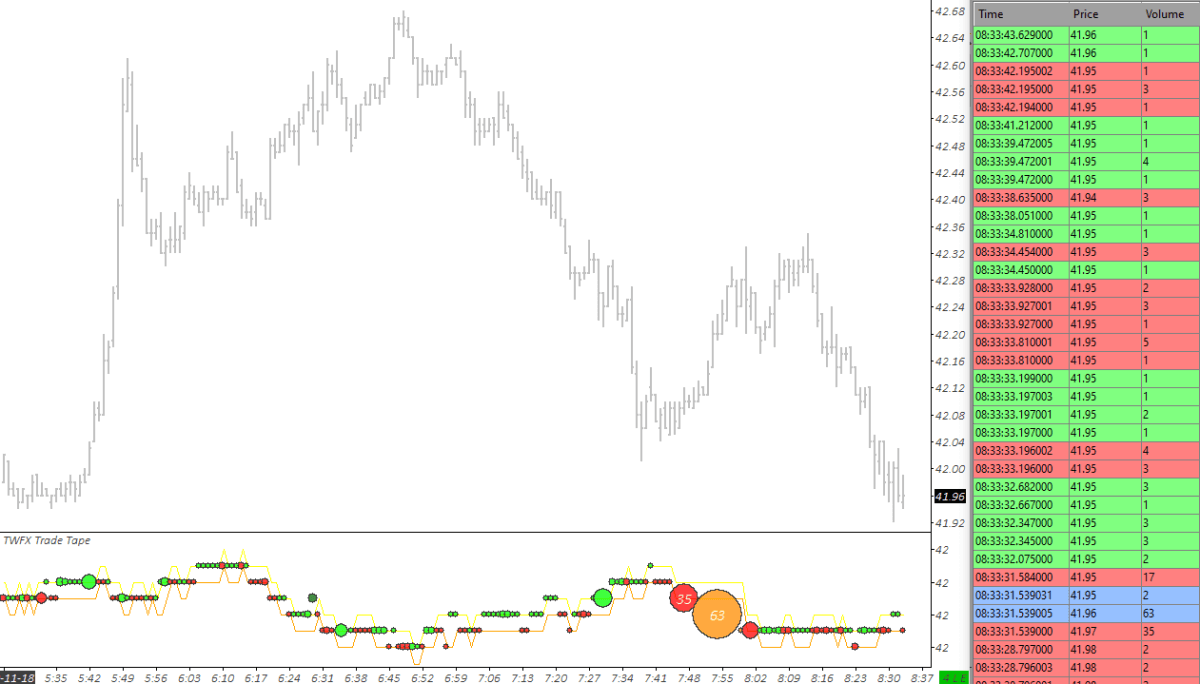
The Trade Tape Study displays a visual Time & Sales representation, in the form of scrolling price lines, circular markers and text.
Various configuration options are provided to give flexibility in both how the trade tape is displayed and how it is calculated.
The study is summarised in the following update post – Trade Tape.
Note:
- This study can only be used on charts with a chart data type of ‘Intraday Chart‘
- It is requirement to use ‘Intraday Data Storage Time Unit‘ setting ‘1 Tick’
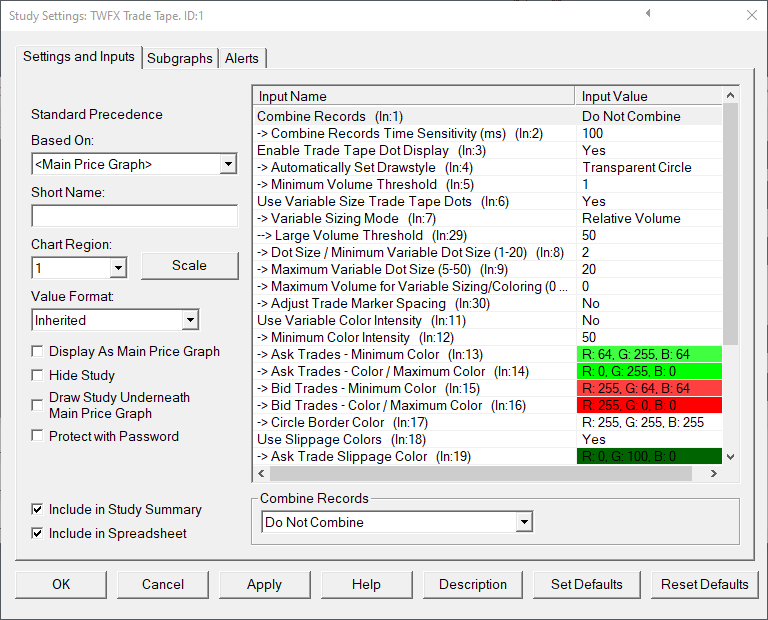
Inputs
Defines the method used for combining individual trades to show (or approximate) the size of the market orders that have traded against multiple limit orders.
- Do Not Combine:
Trade records are displayed exactly as received; each marker represents a single trade. - Same Time and Price:
Sequences of trade records are combined if the following conditions are met:- Trade price is identical;
- Trade type is identical (i.e. Ask or Bid);
- Trade occurs within the time window defined by input 2 – Combine Records Time Sensitivity (ms) – relative to the first combined trade.
- Same Time and Type:
Sequences of trade records are combined if the following conditions are met:- Trade type is identical (i.e. Ask or Bid);
- Trade occurs within the time window defined by input 2 – Combine Records Time Sensitivity (ms) – relative to the first combined trade.
Note: When using this option, trades occurring across multiple price levels can be combined, in which case they will be displayed at the price of the first combined trade.
- Combine into Exchange Reported Summary Trade: Trades are combined into the original exchange reported summary trade.
Note: Applies only to CME symbols and Sierra Chart provided data feed, if used with any other symbol or data feed this setting has no effect and trades will be displayed as per ‘Do Not Combine’.
Defines the size of the time window in which trades can be combined, relative to the first combined traded.
Applies only to combining options ‘Same Time and Price’ and ‘Same Time and Type’.
- Min: 1ms
- Max: 1000ms
Trade tape dots can be disabled if text only output is preferred.
Sets the drawstyle for the trade tape dots from a list of recommended options.
To use alternative options set to ‘No’ and select the desired drawstyle on the subgraphs tab of the study settings window.
Defines the minimum trade volume required before a trade tape dot is displayed.
- Min: 0
- Max: 1000000
When enabled the trade tape dot sizing is determined according to the ‘Variable Sizing Mode’ and associated parameters, otherwise the ‘Dot Size / Minimum Variable Dot Size’ is used.
Defines the method for determining the Trade Tape dot size.
- Relative Volume:
The size of the trade tape dot is calculated based upon the volume as a percentage of the highest volume trade tape dot currently displayed, the ‘Minimum Variable Dot Size’ and the ‘Maximum Variable Dot Size’.
Depending on the ‘Max Records to Display’ setting and the width of the chart to which the study is applied, the highest volume trade tape dot may not be visible on screen. - Small & Large:
The size of the trade tape dot is either Small or Large, depending on whether or not the trade volume is greater than the specified ‘Large Volume Threshold’.
– Small trade tape dots are drawn using the ‘Dot Size / Minimum Variable Dot Size’ parameter.
– Large trade tape dots are drawn using the ‘Maximum Variable Dot Size’ parameter. - Fixed Size Range:
The size of the trade tape dot is calculated based upon the volume relative to the range between the ‘Minimum Volume Threshold’ and ‘Maximum Volume for Scaling/Coloring’.
If the volume exceeds the ‘Maximum Volume for Scaling/Coloring’ then the ‘Maximum Variable Dot Size’ parameter will used.
NOTE: If ‘Maximum Volume for Scaling/Coloring’ is not defined, or is less than ‘Minimum Volume Threshold’ then the Variable Sizing Mode will revert to ‘Relative Volume’ mode.
Defines the minimum trade volume required before a trade tape dot is considered ‘Large’ in the context of the ‘Small & Large’ variable sizing mode.
- Min: 1
- Max: 1000000
Defines the trade tape dot size when ‘Use Variable Size Trade Tape Dots’ is disabled, otherwise defines the minimum size used when calculating the trade tape dot size, or the size used for small trade tape dots.
- Min: 1
- Max: 20
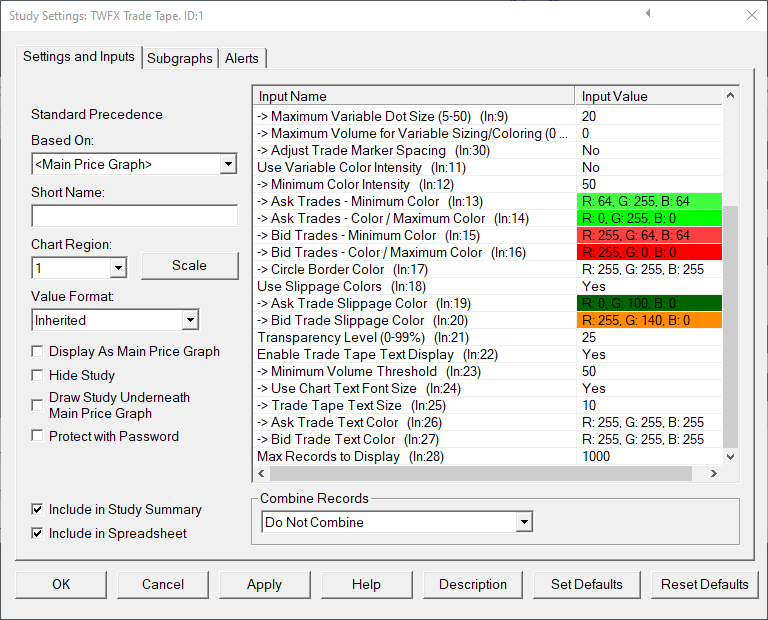
Defines the maximum size used when calculating the trade tape dot size, or the size used for large trade tape dots.
- Min: 5
- Max: 50
Maximum Volume for Variable Sizing/Coloring (In:10)
Defines the maximum volume used when calculating variable size or variable coloring trade tape dots.
If the traded trade volume exceeds this value, it will be substituted in place of the actual volume.
Note: This setting is ignored if set to 0.
- Min: 0
- Max: 1000000
Adjust Trade Marker Spacing (In:30)
When enabled, the trade tape dots spacing will be automatically increased to prevent larger markers overlapping.
Use Variable Color Intensity (In:11)
When enabled, the trade tape dot color is calculated based upon the volume as a percentage of the highest volume trade tape dot currently displayed and the minimum and maximum colors.
The actual color displayed is interpolated between the minimum and maximum colors.
Depending on the ‘Max Records to Display’ setting and the width of the chart to which the study is applied, the highest volume trade tape dot may not be visible on screen.
Minimum Color Intensity (In:12)
The minimum color intensity value to be used when calculating interpolated colors.
- Min: 0%
- Max: 100%
Ask Trades – Minimum Color (In:13)
Defines the color used for ask trades having the lowest volume – the lower boundary color when calculating interpolated colors.
Ask Trades – Color / Maximum Color (In:14)
Defines the color used for ask trades having the highest volume – the upper boundary color when calculating interpolated colors.
Used for all ask trade tape dots when variable color intensity is disabled.
Bid Trades – Minimum Color (In:15)
Defines the color used for bid trades having the lowest volume – the lower boundary color when calculating interpolated colors.
Bid Trades – Color / Maximum Color (In:16)
Defines the color used for bid trades having the highest volume – the upper boundary color when calculating interpolated colors.
Used for all bid trade tape dots when variable color intensity is disabled.
Circle Border Color (In:17)
Applies to ‘Circle with Border’ drawstyle only.
Use Slippage Colors (In:18)
When this option is enabled, trades that occur above the last updated best ask or below the last updated best bid are displayed using the specified slippage colors, instead of the standard ask and bid colors.
Ask Trade Slippage Color (In:19)
Defines the color used for trade tape dots where the trade has occurred above the last updated best ask price.
Bid Trade Slippage Color (In:20)
Defines the color used for trade tape dots where the trade has occurred below the last updated best bid price.
Transparency Level (0-99%) (In:21)
Set the transparency level used when drawing trade tape dots.
Using transparency in conjunction with variable coloring is not recommended, as it can make the variable color graduations much less apparent.
Enable Trade Tape Text Display (In:22)
When enabled, text showing the actual trade volume can be displayed in addition to (or instead of) the trade tape dots.
Minimum Volume Threshold (In:23)
Defines the minimum trade volume required before trade tape text is displayed.
- Min: 1
- Max: 100000
Use Chart Text Font Size (In:24)
Automatically set the trade tape text size based on the chart font.
This setting is ignored when using OpenGL graphics and instead the ‘Trade Tape Text Size’ input is always used.
Trade Tape Text Size (In:25)
Defines the font size (in pixels) used when displaying the trade tape text display.
- Min: 5
- Max: 20
Ask Trade Text Color (In:26)
Defines the text color used for ask trades.
Bid Trade Text Color (In:27)
Defines the text color used for bid trades.
Max Records to Display (In:28)
Defines the maximum number of trade tape records to display on the chart.
This setting will also impact the variable sizing and coloring calculations.
- Min: 100
- Max: 10000
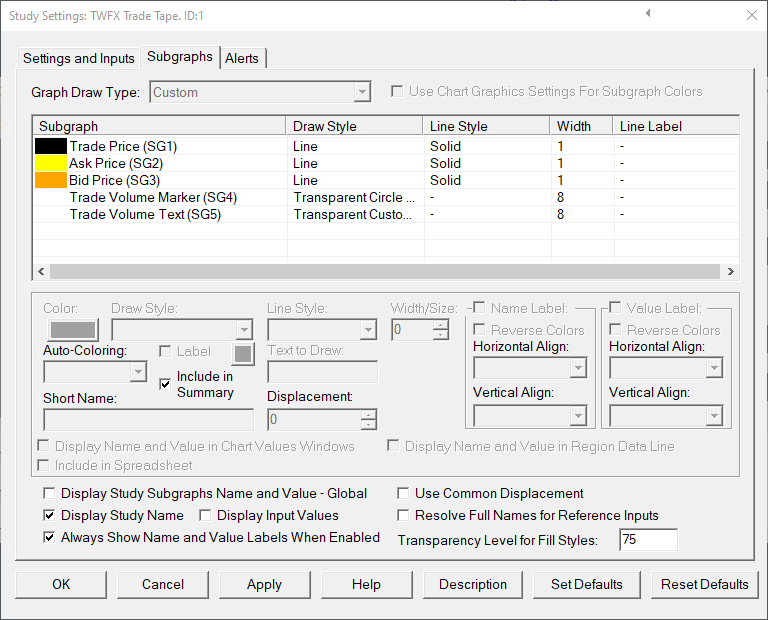
Subgraphs
Trade Price (SG1)
Default: Line
Plots the price at which each trade (or combined trade) takes place.
Set to drawstyle to ‘Ignore’ or ‘Hidden’ if the trade price display is not required.
Ask Price (SG2)
Default: Line
Plots the last updated best ask price when each trade takes place.
Set to drawstyle to ‘Ignore’ or ‘Hidden’ if the ask price display is not required.
Bid Price (SG3)
Default: Line
Plots the last updated best bid price when each trade takes place.
Set to drawstyle to ‘Ignore’ or ‘Hidden’ if the bid price display is not required.
Trade Volume Marker (SG4)
Plots the trade tape dots, when enabled, using the drawstyle defined by the ‘Automatically Set Drawstyle’ setting.
Trade Volume Text (SG5)
Plots the trade tape text display, when enabled, using the font size and colors defined by the ‘Trade Tape Text Size’, ‘Ask Trade Text Color’ & ‘Bid Trade Text Color’ settings.