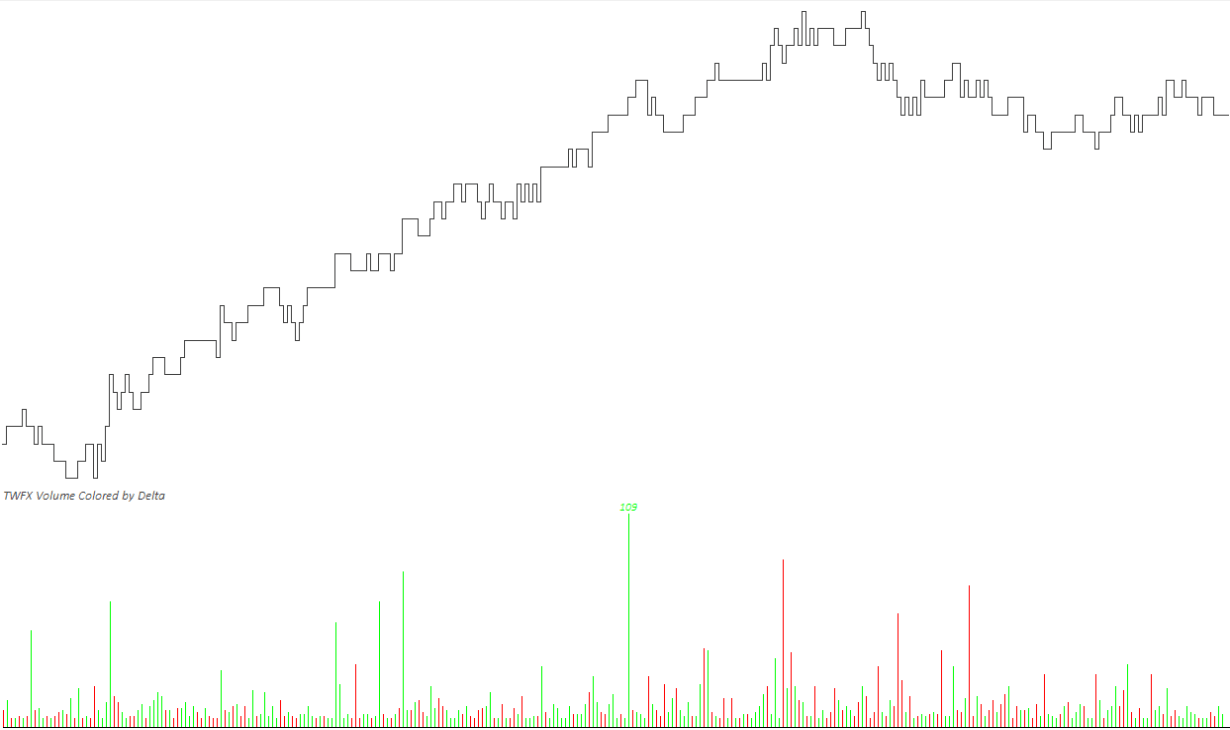
The Volume Colored by Delta study displays traded volume as a histogram with numeric labelling, colored according to the dominant side (ask or bid) volume.
Both the histogram and numeric display outputs can be filtered based on individual minimum volume threshold value.
An additional option is provided so that volume values exceeding a specified threshold value can be highlighted.
The study is summarised in the following update post – Reconstructed Tape Chart.
Note:
- This study can only be used on charts with a chart data type of ‘Intraday Chart‘
- It is required to use ‘Intraday Data Storage Time Unit‘ setting ‘1 Tick’
- The study is designed specifically to be used in conjunction with the TWFX Trade Tape Chart study, however it is not limited to being used in this configuration.
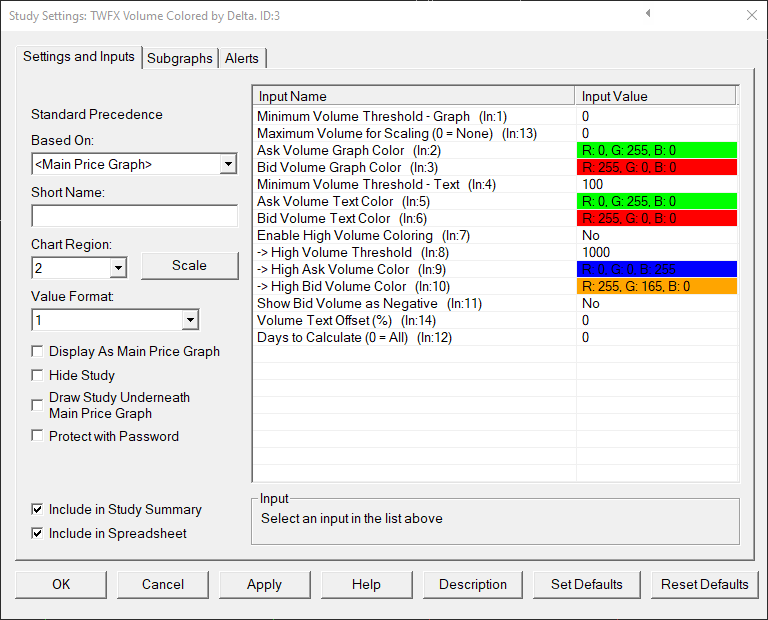
Inputs
Minimum Volume Threshold – Graph (In:1)
Defines the minimum trade volume required before a volume historgram bar is displayed.
- Min: 0
- Max: 1000000
Maximum Volume for Scaling (0 = None) (In:13)
Defines the maximum volume used for histogram bar height, can be useful to prevent outlier high volume values affecting the scaling of all histogram bars.
If volume >= maximum volume for scaling, then maximum volume for scaling will be used instead of the actual volume.
NOTE: Text output is not affected by this setting and will always reflect the actual volume.
- Min: 0 (Actual volume is always used)
- Max: 1000000
Ask Volume Graph Color (In:2)
Defines the color used to draw histogram bars when ask volume >= bid volume.
Bid Volume Graph Color (In:3)
Defines the color used to draw histogram bars when bid volume > ask volume.
Minimum Volume Threshold – Text (In:4)
Defines the minimum trade volume required before a numeric volume label is displayed.
- Min: 0
- Max: 1000000
Ask Volume Text Color (In:5)
Defines the color used to draw numeric labels when ask volume >= bid volume.
Bid Volume Text Color (In:6)
Defines the color used to draw numeric labels when bid volume > ask volume.
Enable High Volume Coloring (In:7)
When this setting is enabled, if traded volume exceeds the ‘High Volume Threshold’ then the ‘High Ask Volume Color’ or ‘High Bid Volume Color’ will be used when coloring both the histogram display and the numeric label.
High Volume Threshold (In:8)
Defines the minimum trade volume required before high volume coloring is used.
- Min: 0
- Max: 1000000
High Ask Volume Color (In:9)
Defines the color used for both histogram bars and numeric labels, when the ‘High Volume Threshold’ is met or exceeded, and ask volume >= bid volume.
High Bid Volume Color (In:10)
Defines the color used for both histogram bars and numeric labels, when the ‘High Volume Threshold’ is met or exceeded, and bid volume > ask volume.
Show Bid Volume as Negative (In:11)
When this setting is enabled, ask volume and bid volume are displayed as positive and negative numbers respectively, centered about the x axis (zero).
Volume Text Offset (%) (In:14)
Defines if / how far to shift text up (or down) beyond the end of the volume histogram bars.
- Min: 0%
- Max: 10%
Days to Calculate (0 = All) (In:12)
Defines the number of days over which the study is calculated, can be used to reduce the initial study calculation time when many days worth of data is loaded into the chart but this study is only required to be shown on the most recent days.
- Min: 0 (in which case all loaded bars are evaluated during the study calculation)
- Max: 1000000
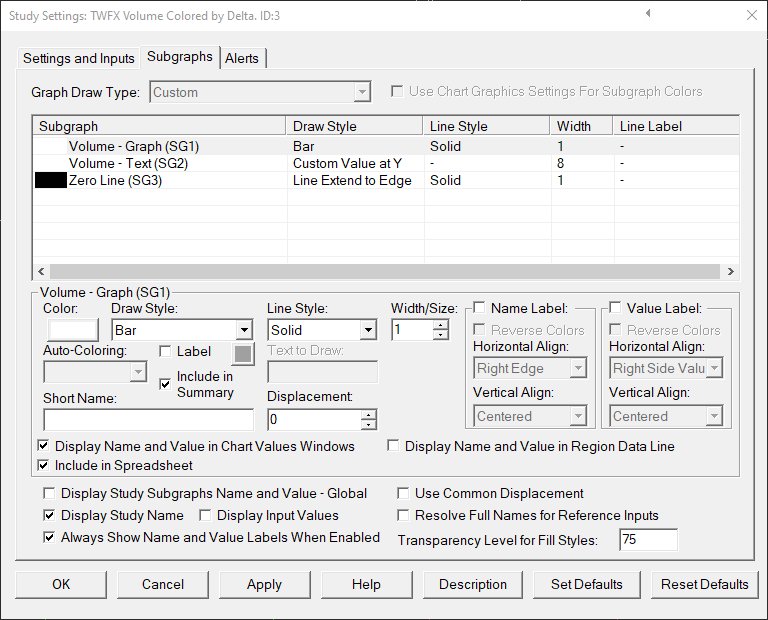
Subgraphs
Volume – Graph (SG1)
Default: Bar
Plots the volume histogram, automatically reverts to default drawstyle if a text drawstyle is selected.
Volume – Text (SG2)
Default: Custom Value at Y
Display the numeric volume labels, automatically reverts to default drawstyle if a graphical drawstyle is selected.
Zero Line (SG3)
Default: Line Extend to Edge
Displays horizontal axis at zero to suit zero centered subgraph display.