
The Basics
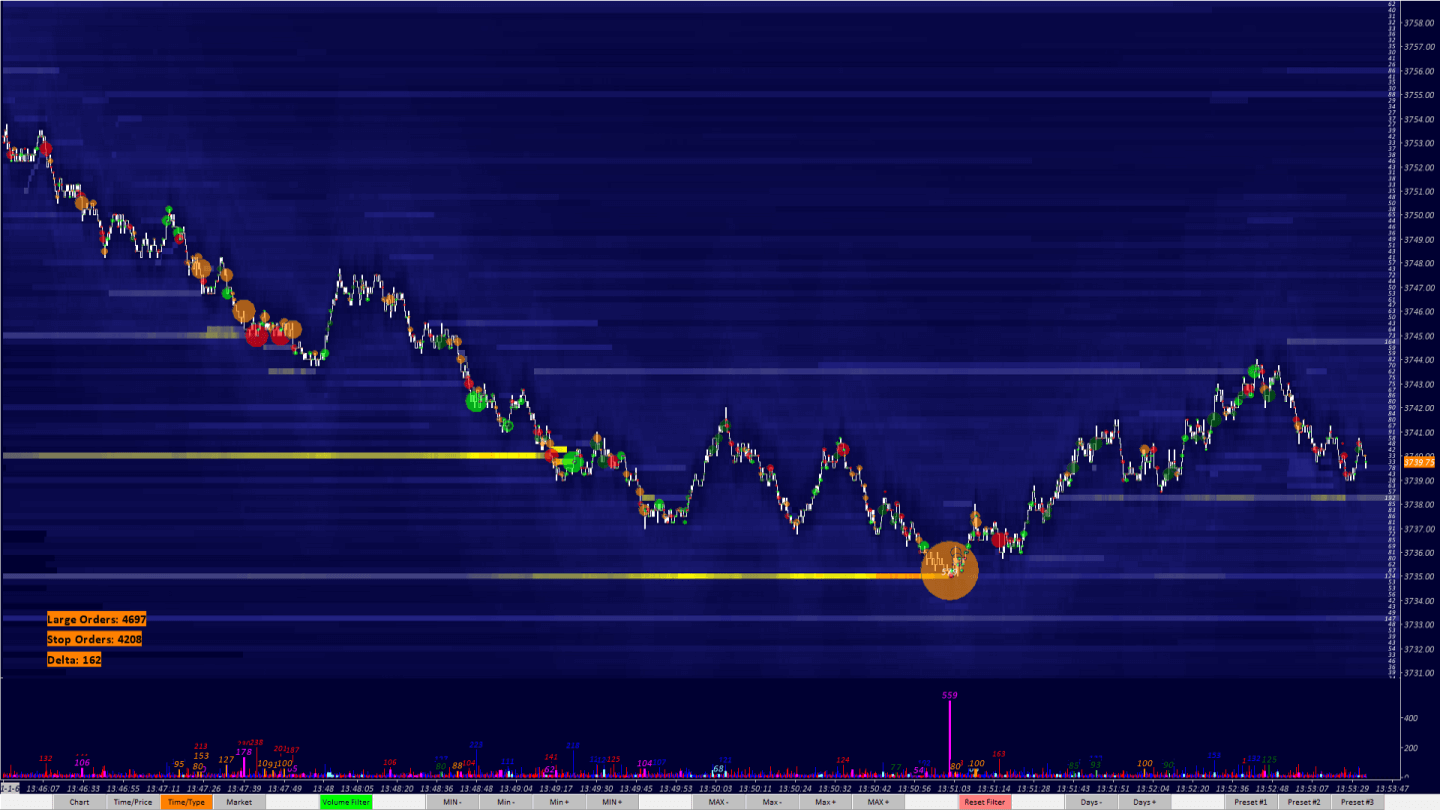
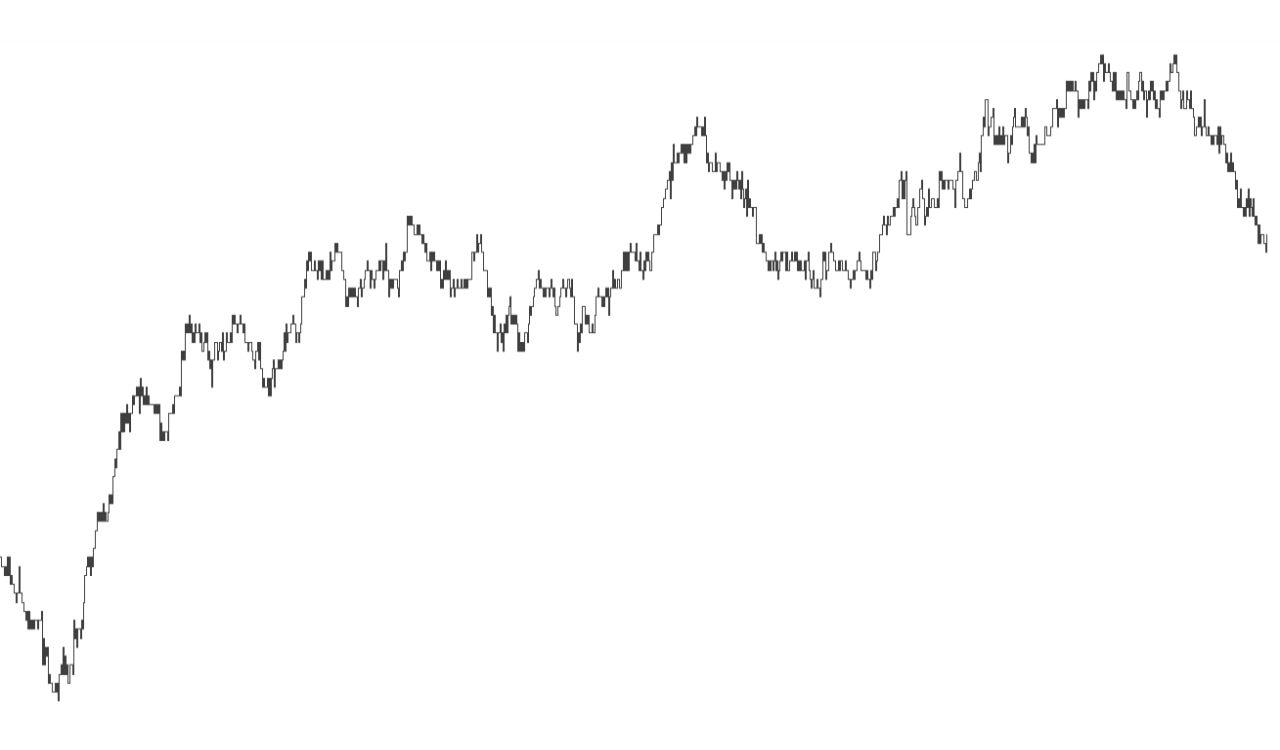
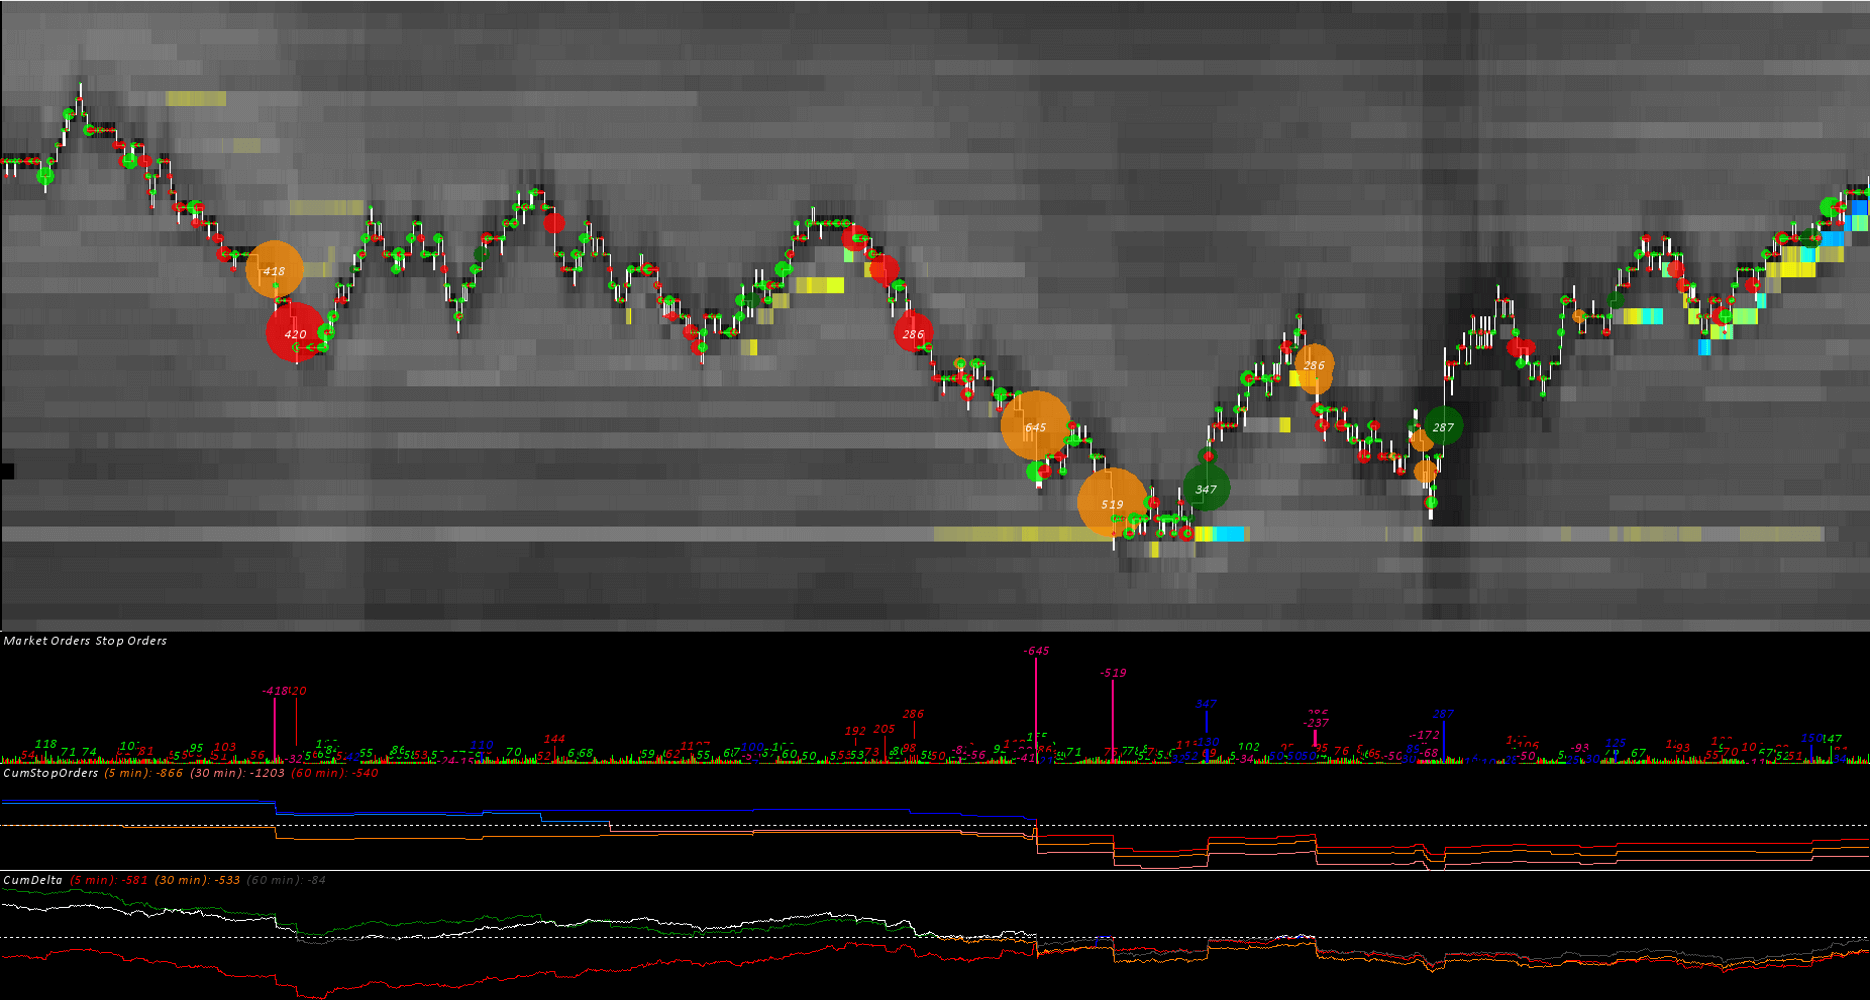
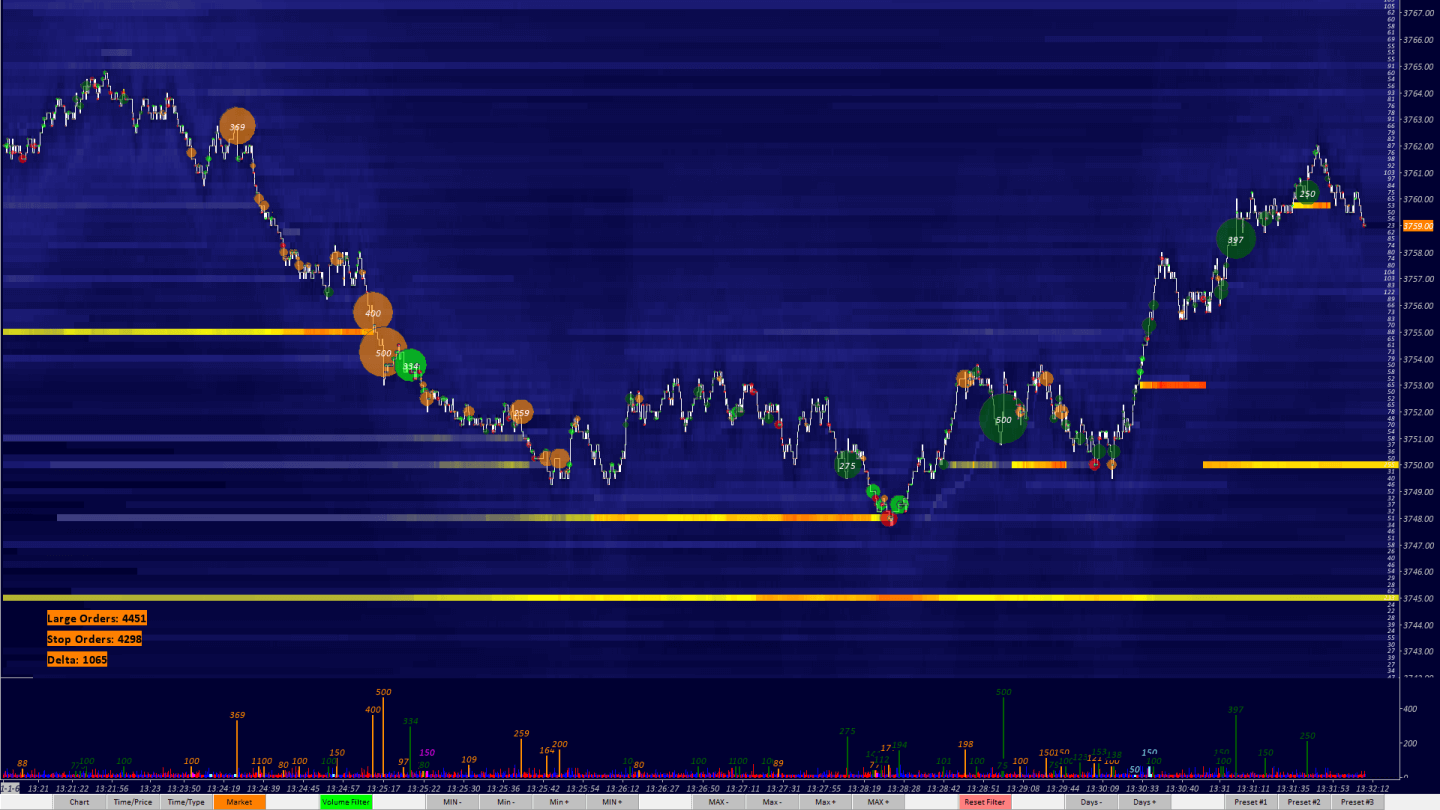
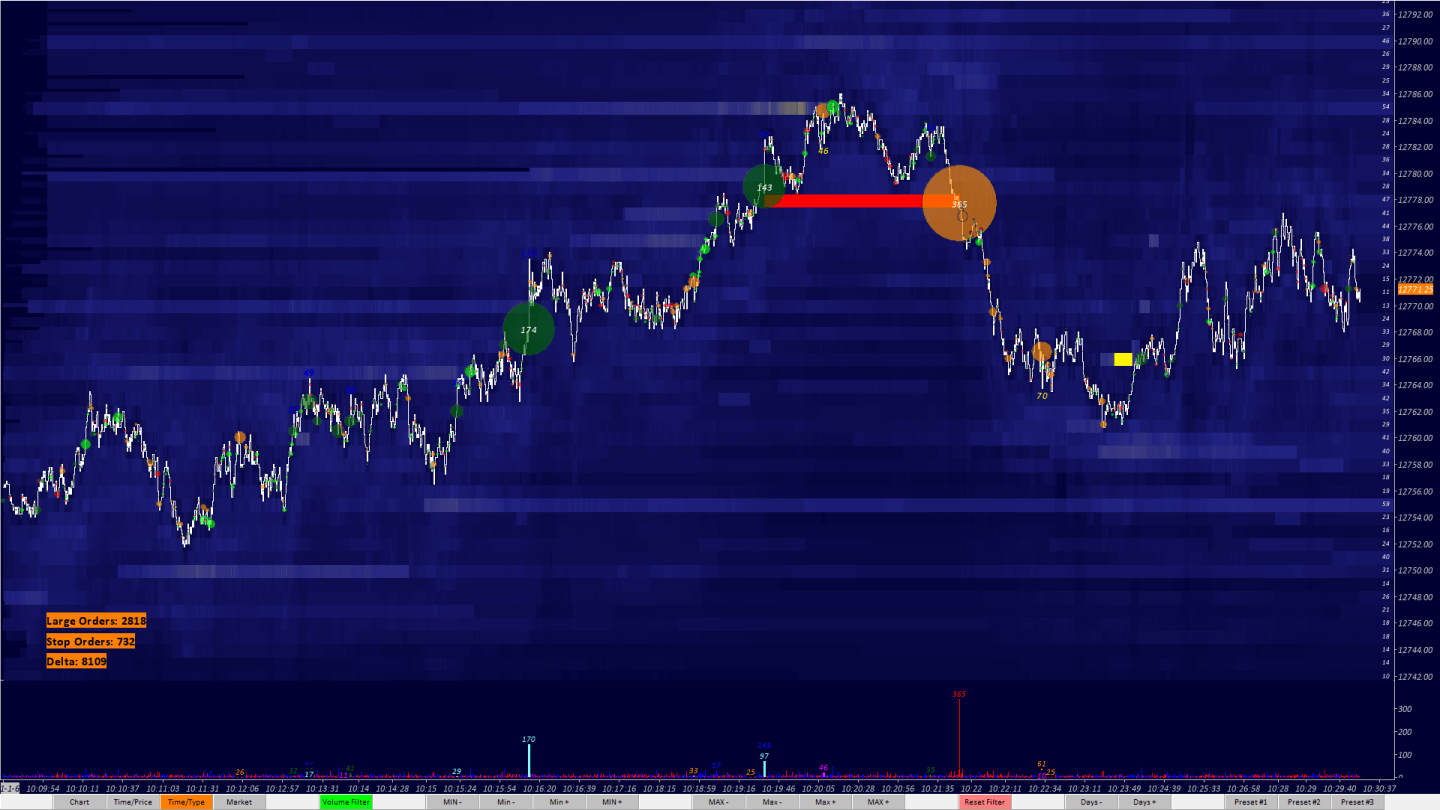
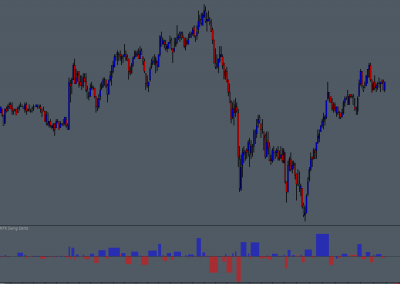
The Reconstructed Tape Chart Study is actually a package of studies centered around a custom chart building study (Trade Tape Chart Study), charts are built such that each bar represents an individual order or a sequence of orders. Detailed orderflow based charts can be easily built, these charts, when used in conjunction with the included support studies, can provide an in depth view of market behavior. Further customization of the main chart view is possible using the available aggregation and filtering options.
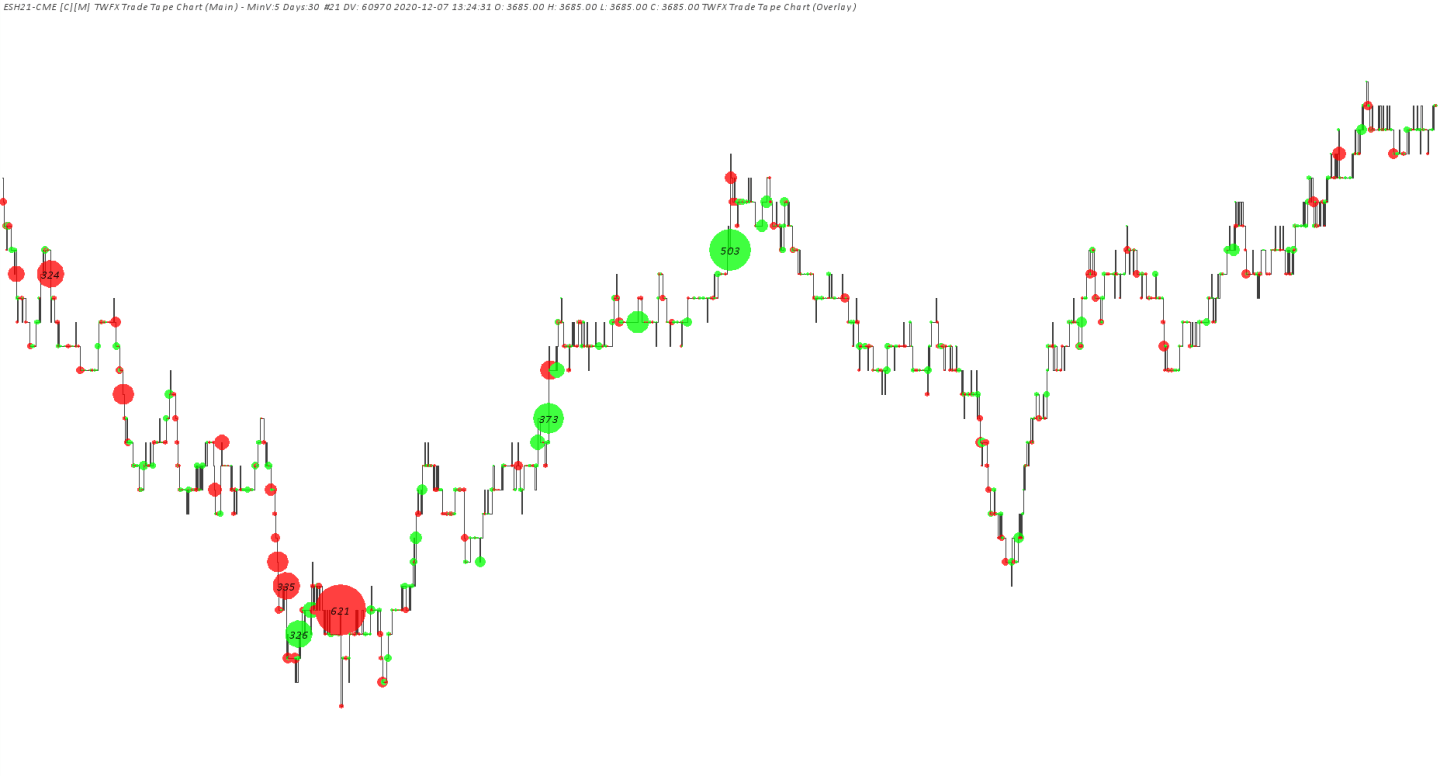
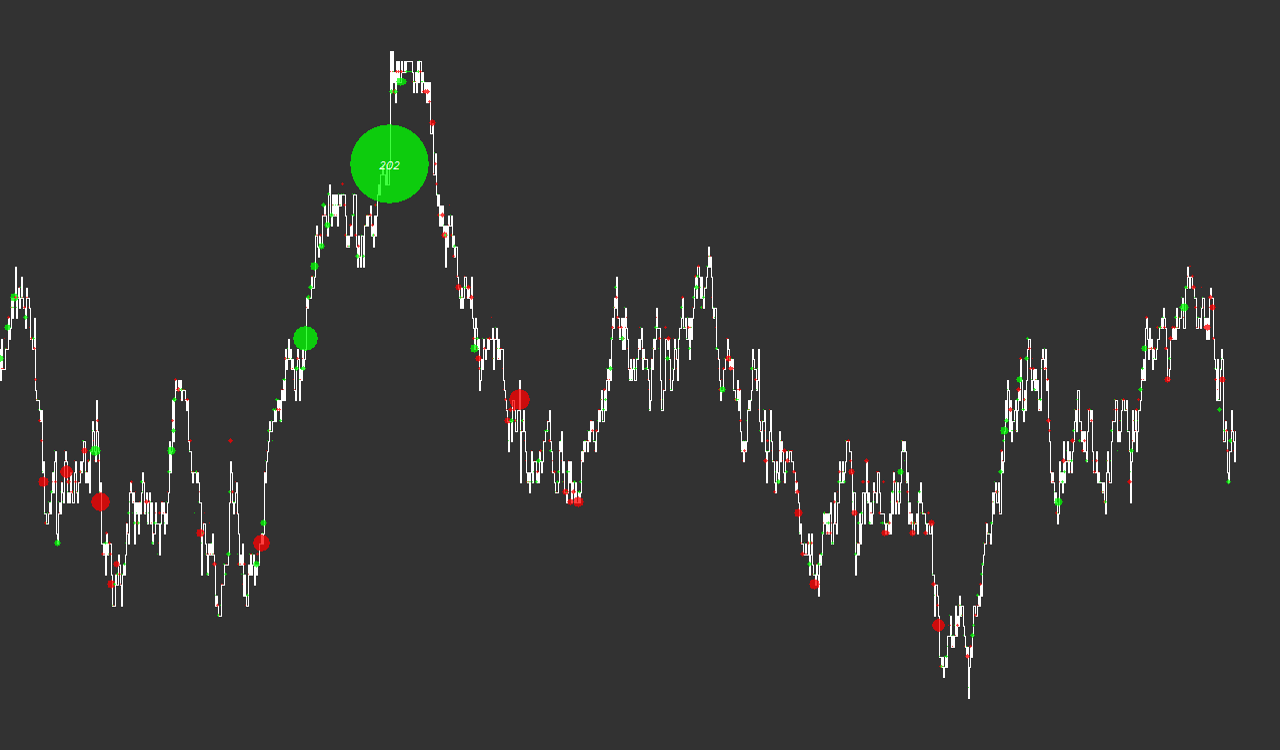
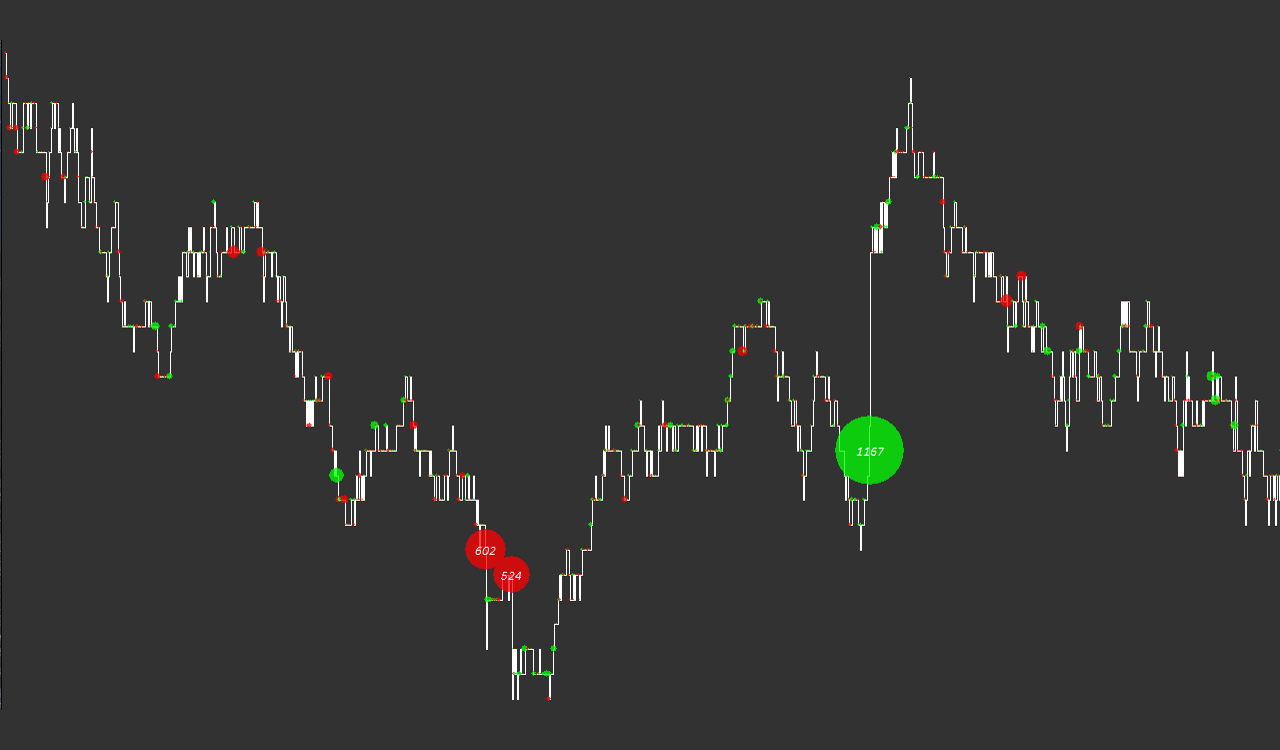
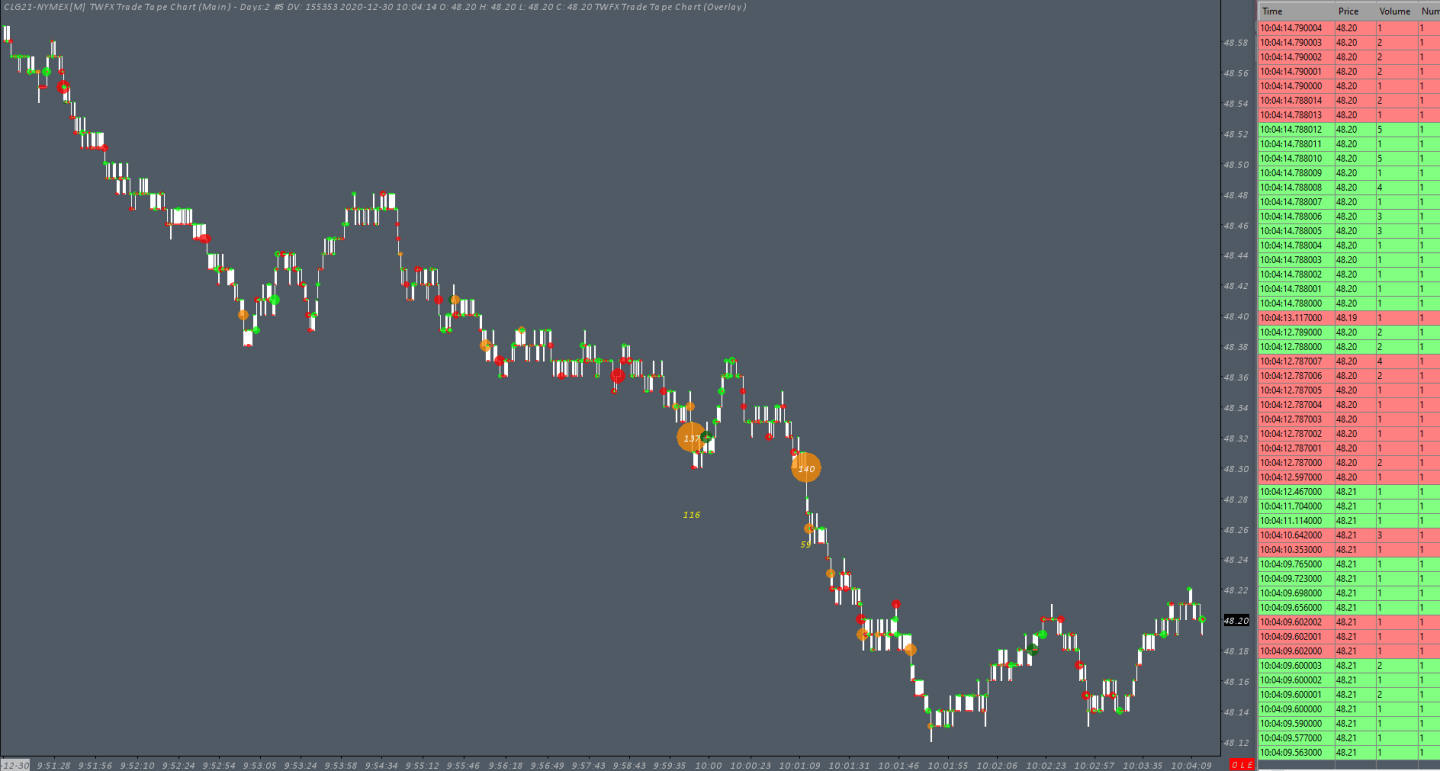
After the custom chart building study itself, the next most important component of the study package is the overlay study (Trade Tape Chart Overlay Study), this study can be used for creating a customizable view of traded volume at price, using a similar concept to the Volume Dots study, circular markers which are scaled automatically according to relative volume.
A full list of the studies included as part of the Reconstructed Tape Chart Study package can be found on the product page – TWFX Reconstructed Tape Chart.
Detailed orderflow based charts can be easily built…
Possible Uses
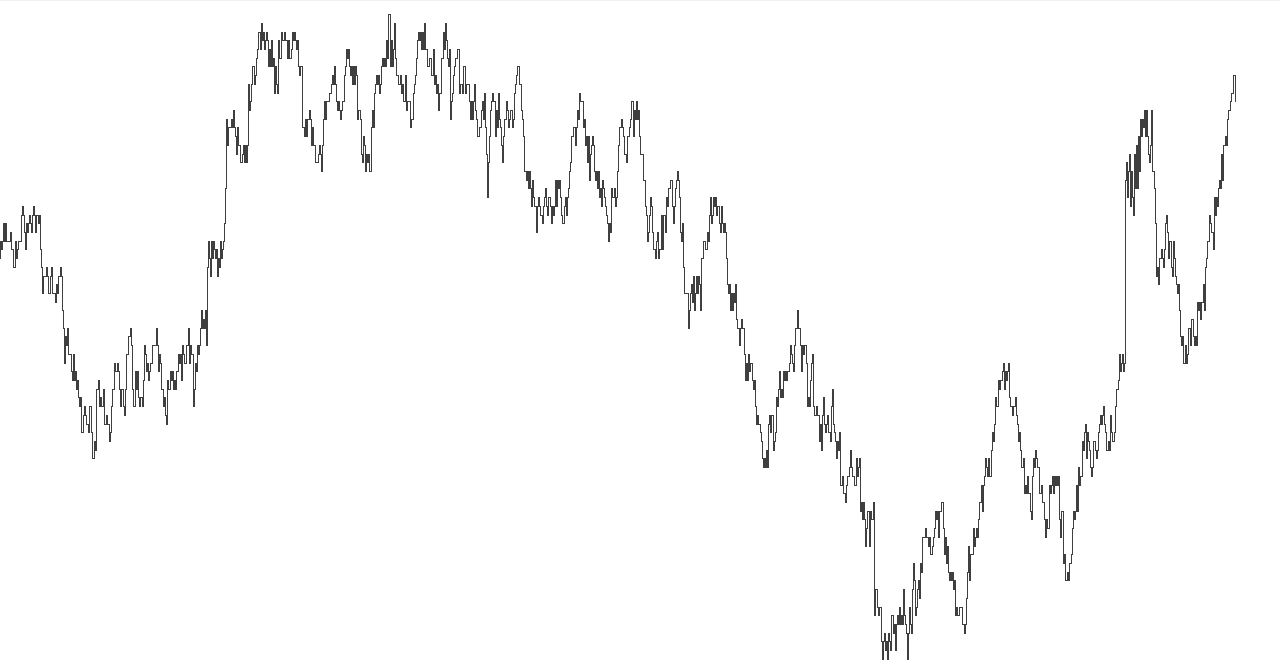
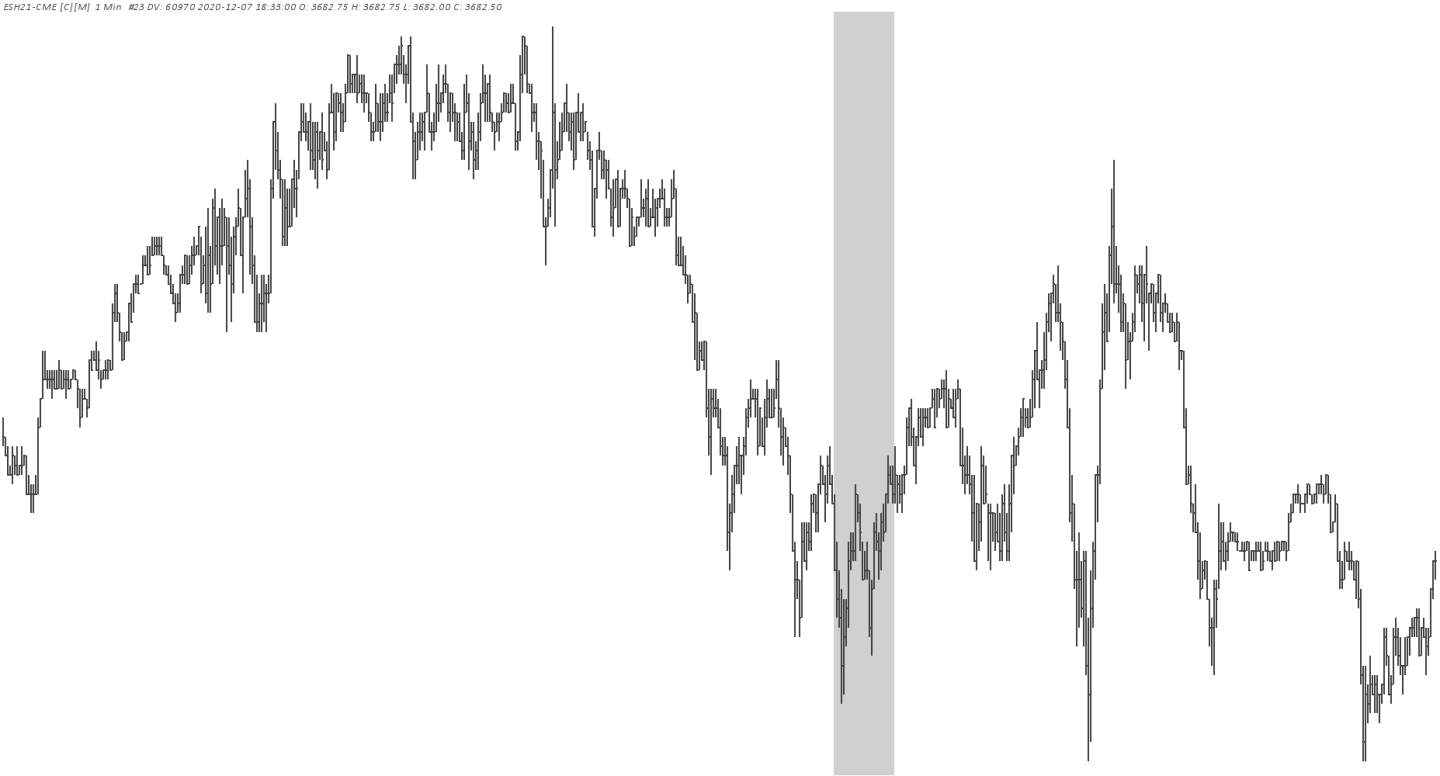
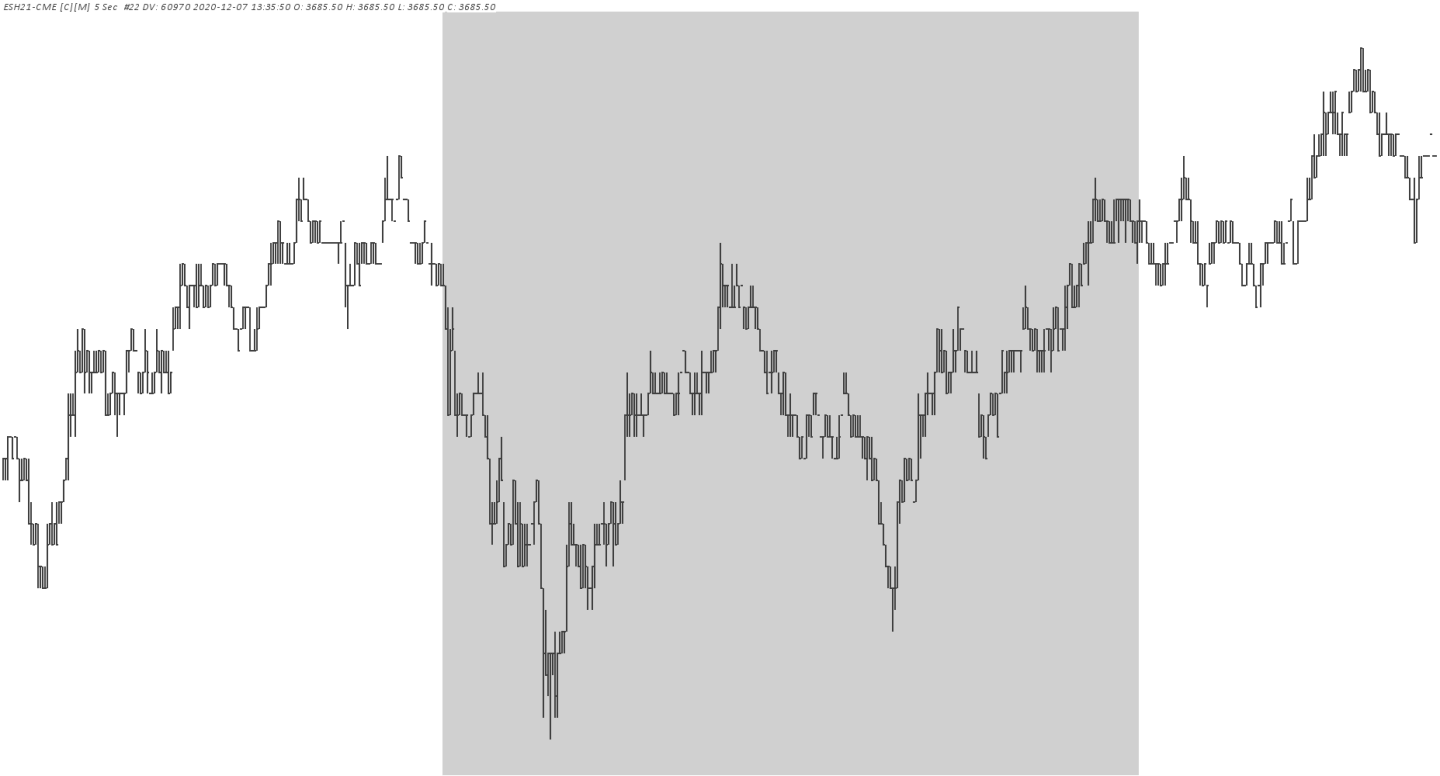
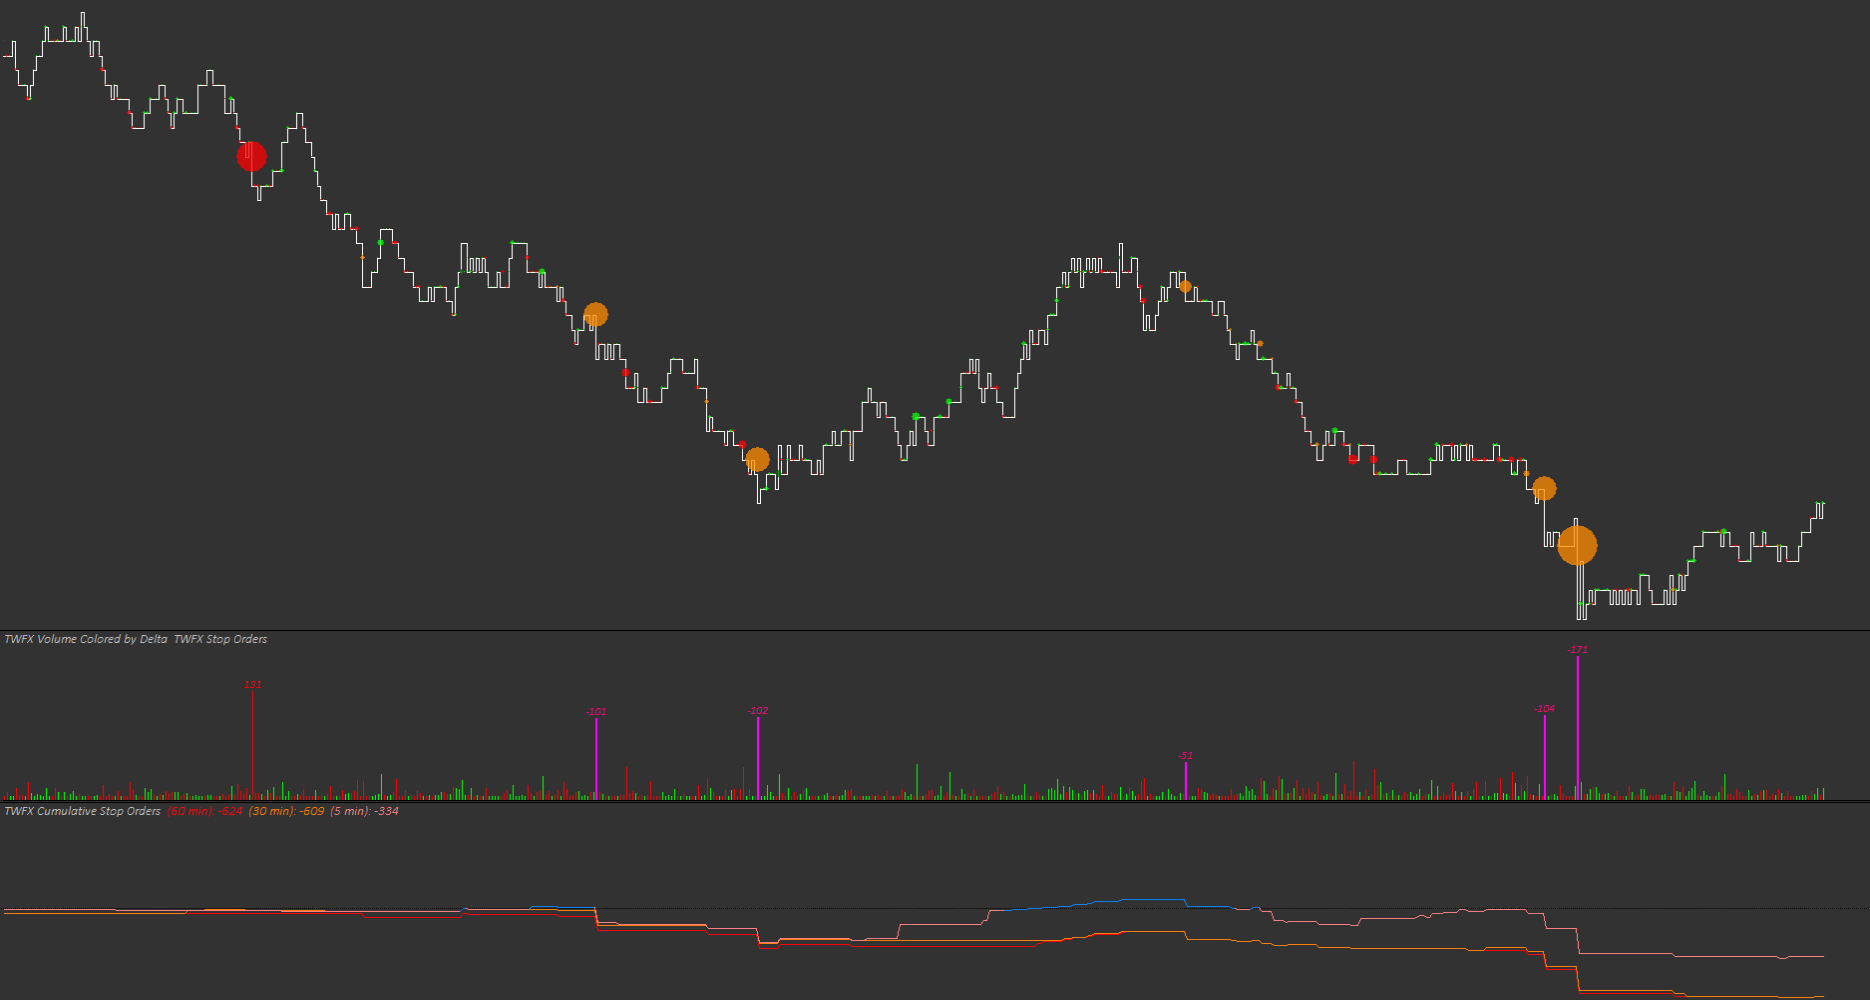
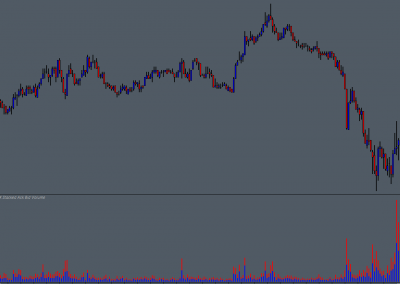
The studies included in the reconstructed tape chart study package make it extremely flexible, in that it can be configured to suit many different uses. For example, custom orderflow charts could be used to supplement the more traditional time, range or volume based charts, with a view to gaining additional orderflow detail around pre-identified areas of interest.
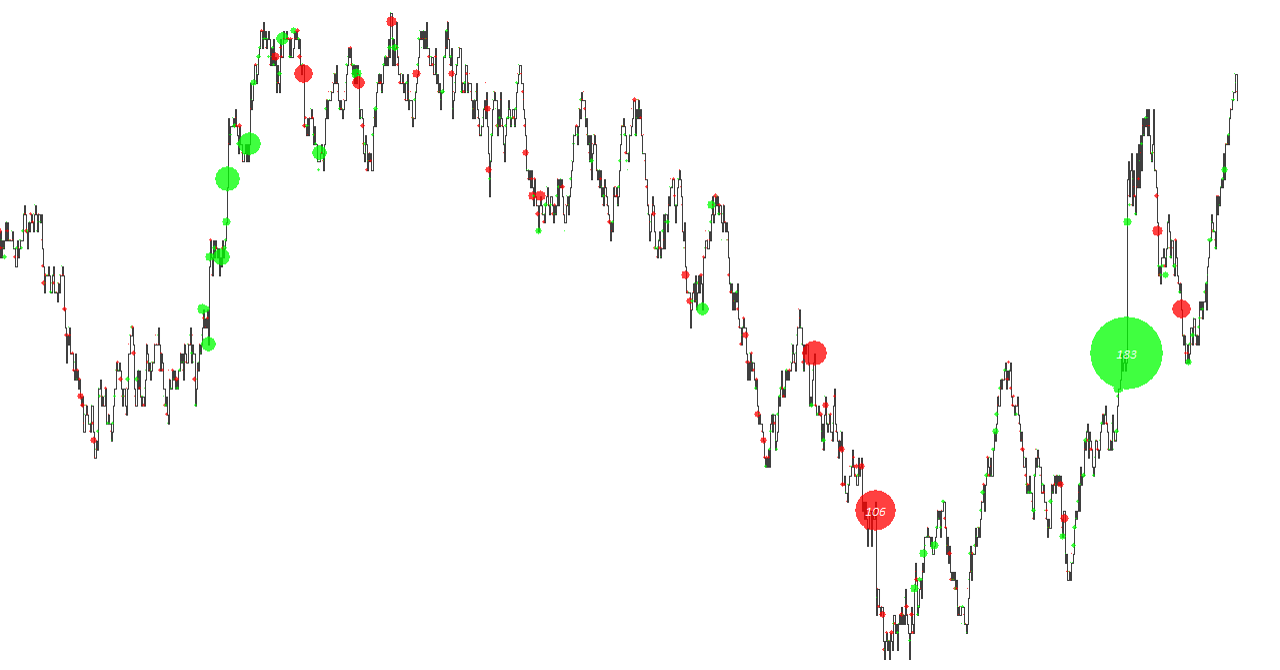
Using the custom chart and overlay studies to visualize orderflow and volume, areas of increased (or decreased) trade activity can be quickly and easily indentified and evaluated. Market conditions such as absorption and exhaustion can be recognized as they happen. The detailed view of orderflow available (either used alone or in conjunction with other methods), provides information that can be used to help qualify entry or exit conditions.
gaining additional orderflow detail around pre-identified areas of interest…
Some More About the Included Studies
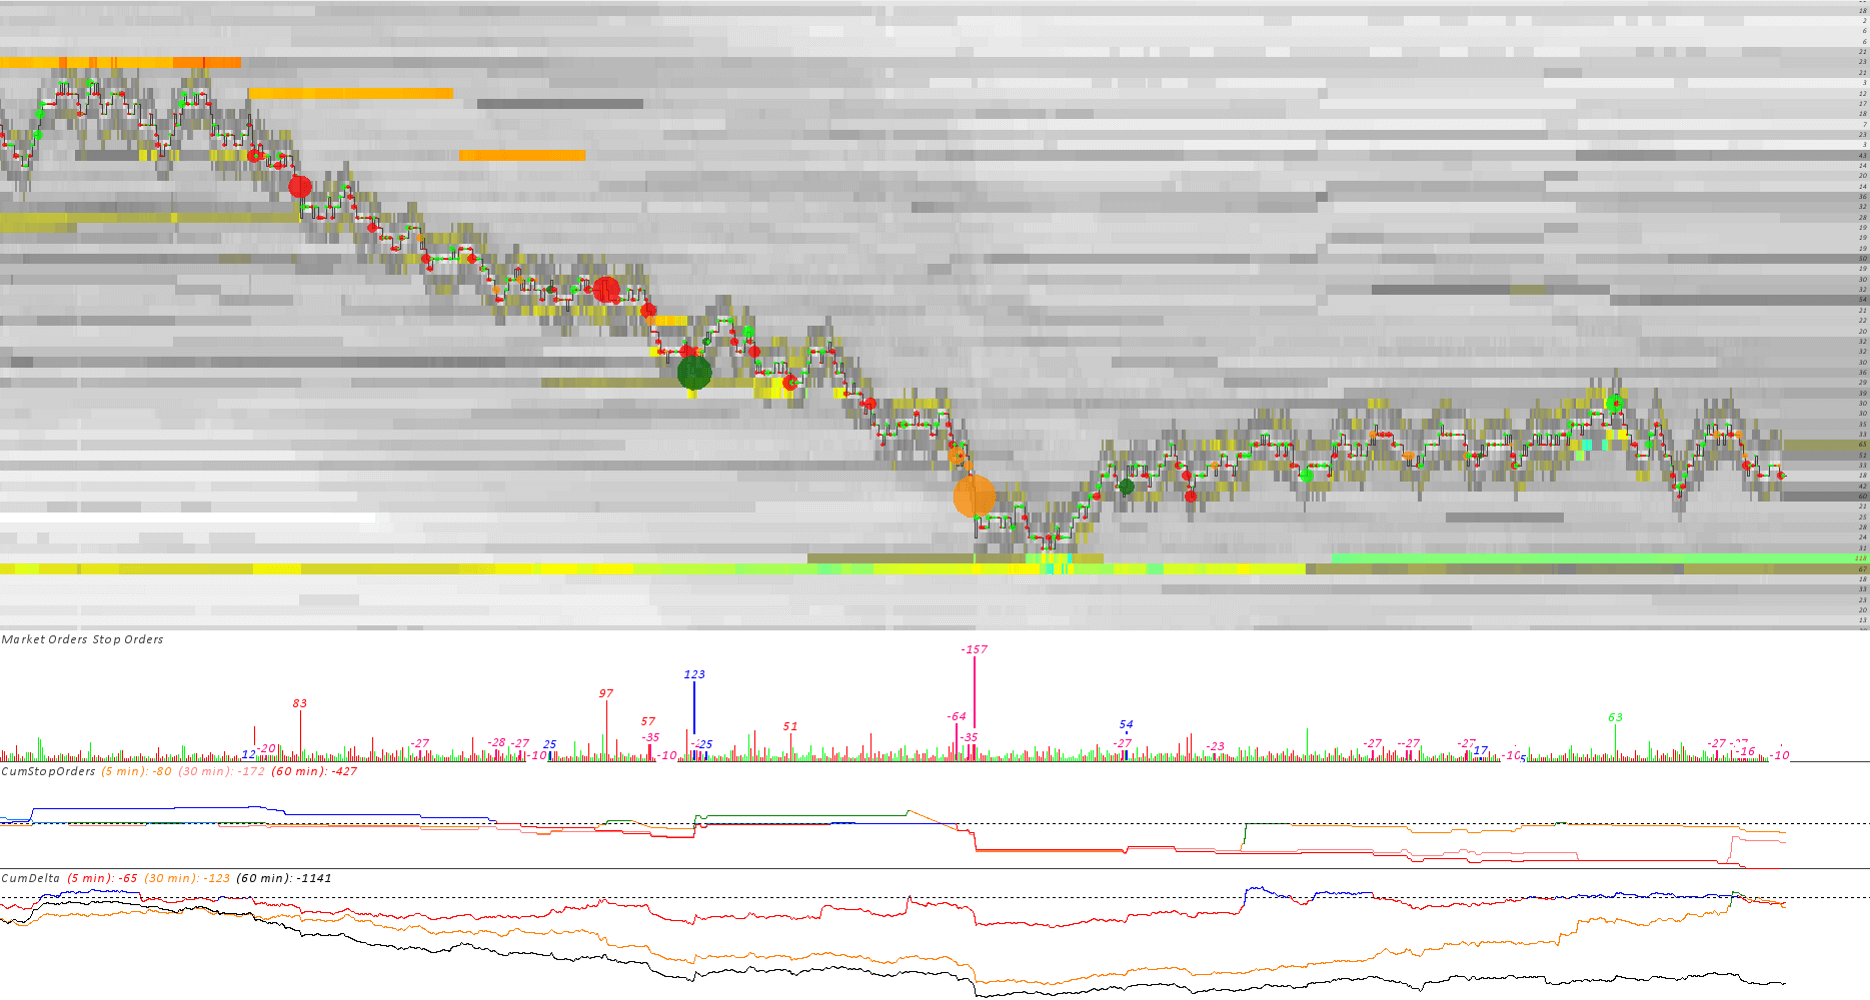
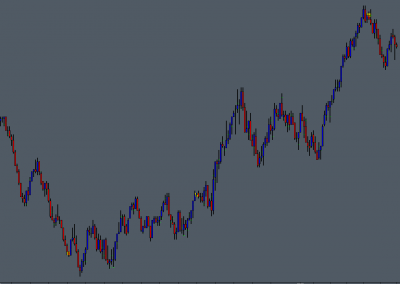
The included support studies enable additional information to be extracted from the custom chart and displayed in a number of different ways. The overlay study, for example, can display volume dots of variable size and/or color intensity, based on relative volume. Additionally the overlay volume dots can be highlighted using alternate colors to indicate that slippage has occurred.
Other studies included as part of the package can be used for displaying order / volume information in different formats and configurations or for providing alerts. The configuration options for each of the support studies is described in the relevant documentation, additionally some of the key features are highlighted below.
Studies Included
10 Studies Included
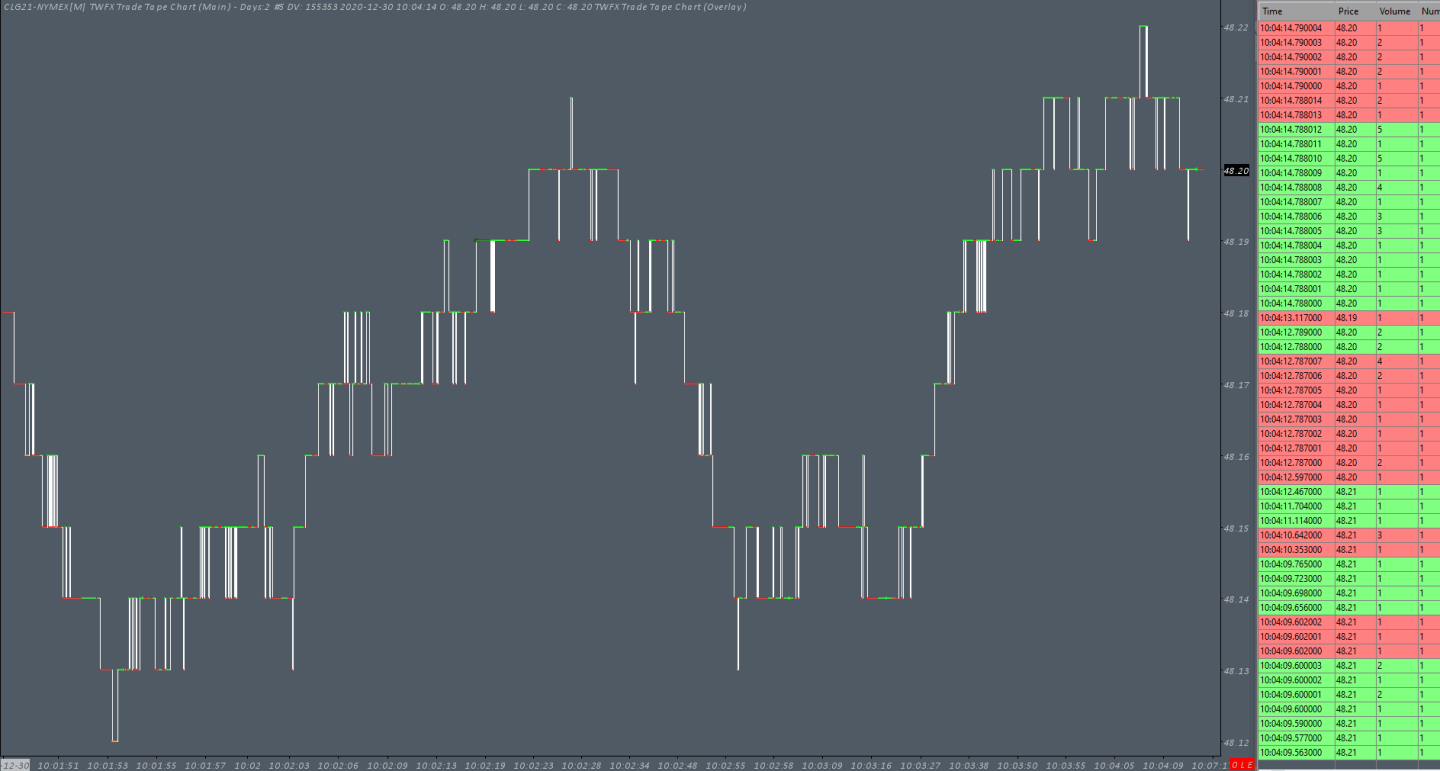
Trade Tape Chart (Main)
The custom chart building study that forms the foundation of the study package. Time and sales data is processed and ordefrlow chart bars are created based on user configurable parameters.
- Choose from four data aggregation (Combine Records) modes, summarized below
- Adjustable trade sequence aggregation time sensitivity
- Trade sequence volume filtering options
- Optional custom study buttons for quick access to data aggregation and volume filtering settings
- Optional plotting of best ask and bid price levels
- Volume dot display
- Optional variable color intensity
- Selection of automatic variable sizing and dot position options
- Highlight trades where slippage has occurred
- Optionally display total trade volume text and/or slippage volume text
Trade Tape Chart (Overlay)
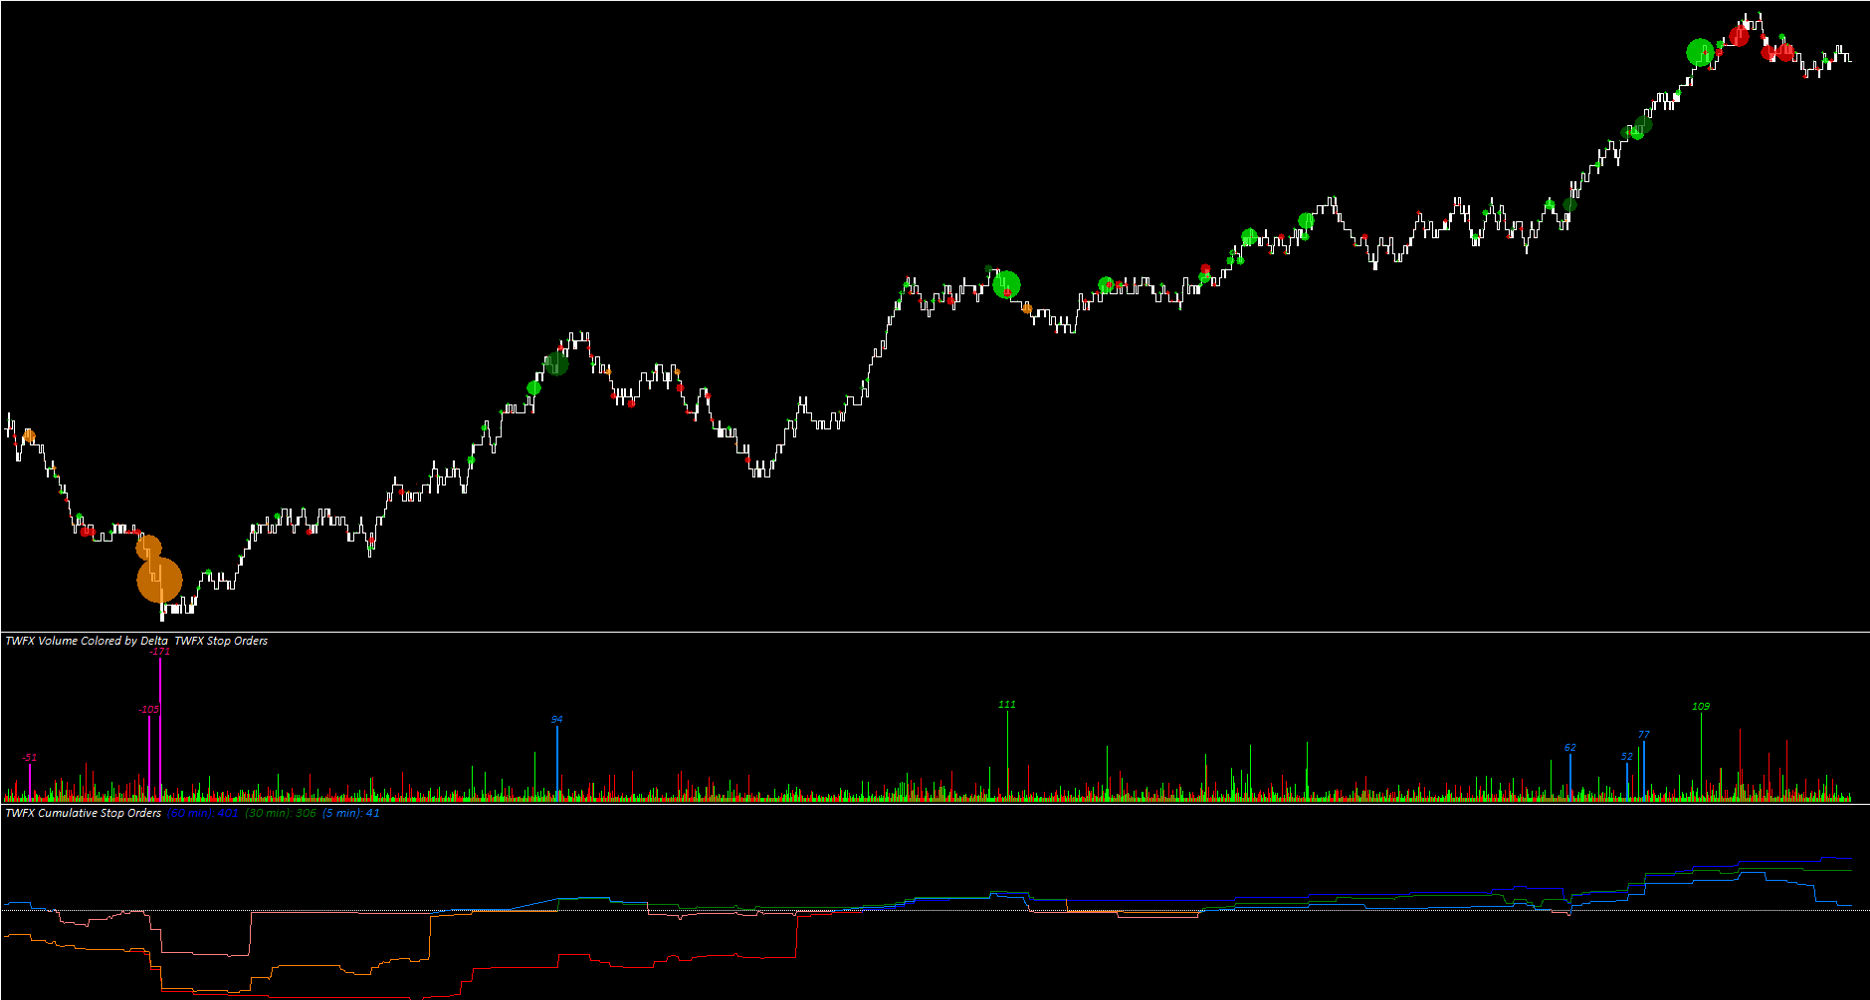
The overlay is used to display a visual representation of relative order volume. Options are provided to control the behavior and appearance of the study output. Volume, location and frequency of trades can be visualized and evaluated efficiently.
- Optional plotting of best ask and bid price levels
- Volume dot display
- Optional variable color intensity
- Selection of automatic variable sizing and dot position options
- Highlight trades where slippage has occurred
- Optionally display total trade volume text and/or slippage volume text
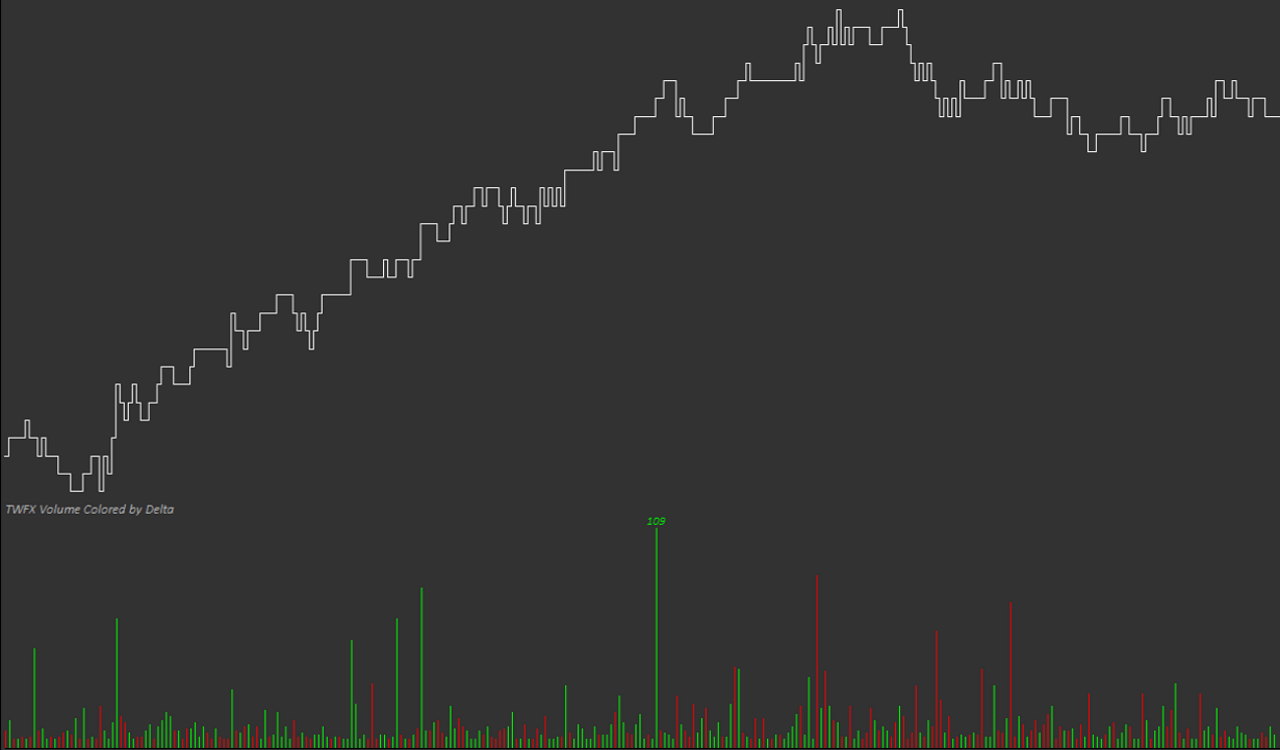
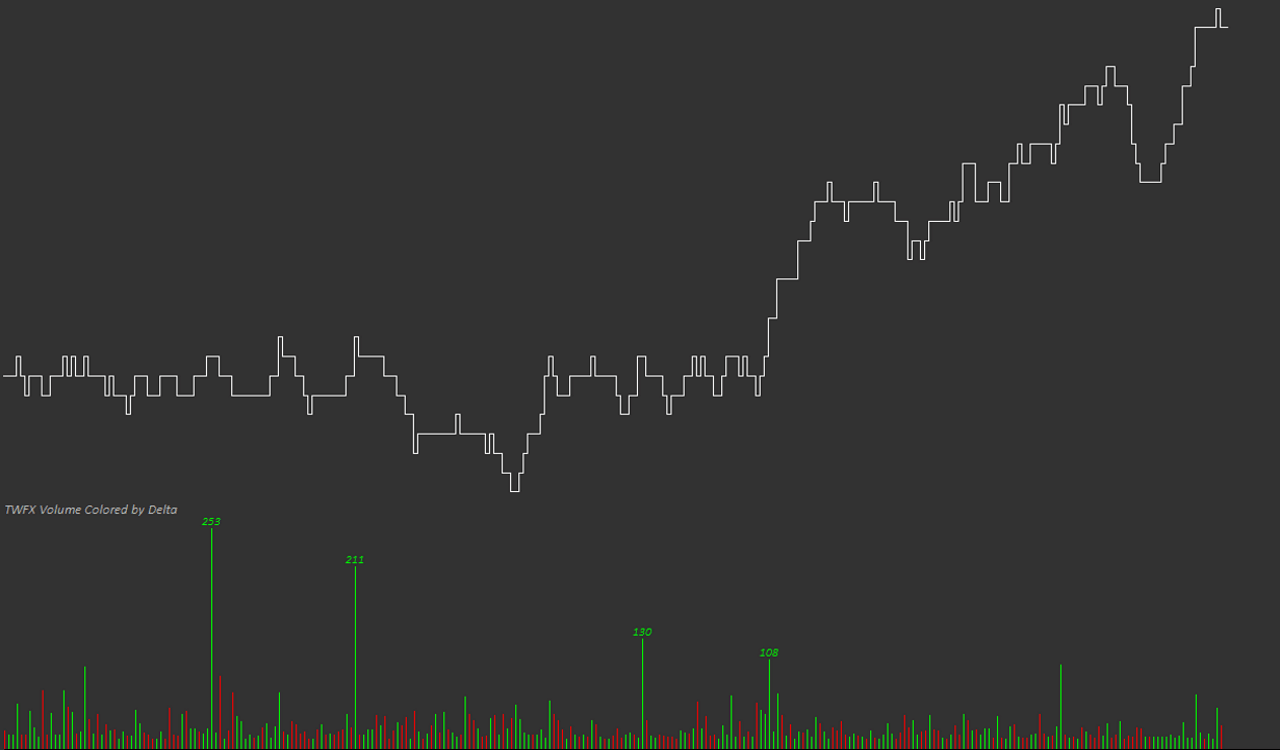
Volume Colored by Delta
Display a traded volume histogram subgraph colored according to aggressor.
- Optional text display with volume filter
- Highlight increased order volume using alternate colors
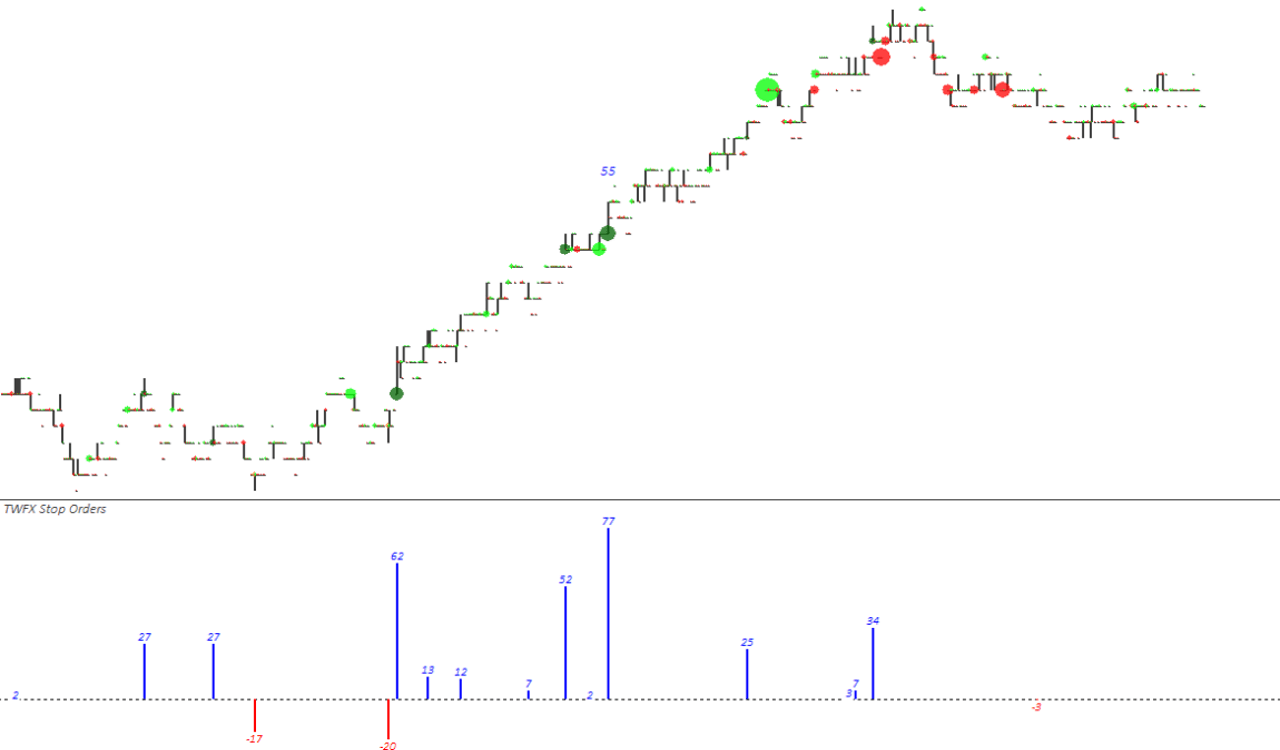
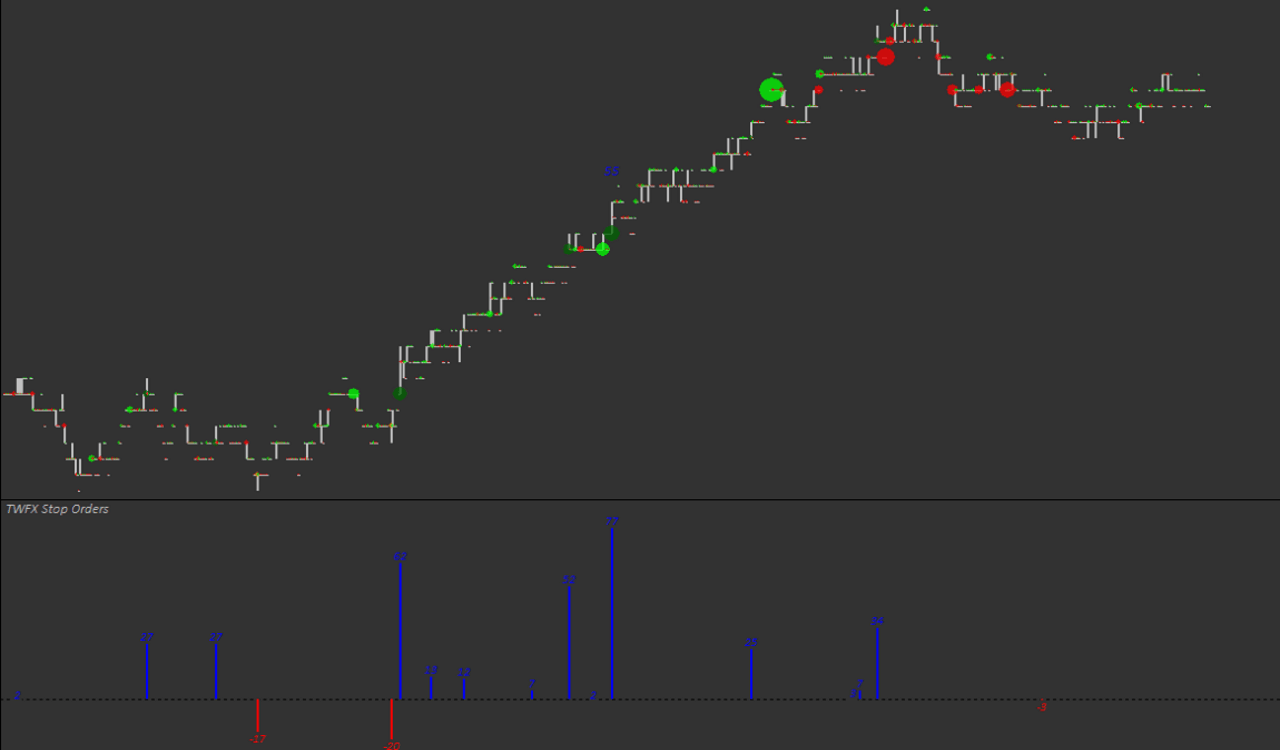
Stop Orders
Display a histogram showing orders indentified as potential stop orders. The method for determining stop orders can be adjusted to suit the trade tape chart configuration.
- Play audible alert when stop order size exceeds threshold value
- Optional text display with volume filter
- Display independently or overlaid onto existing volume histogram
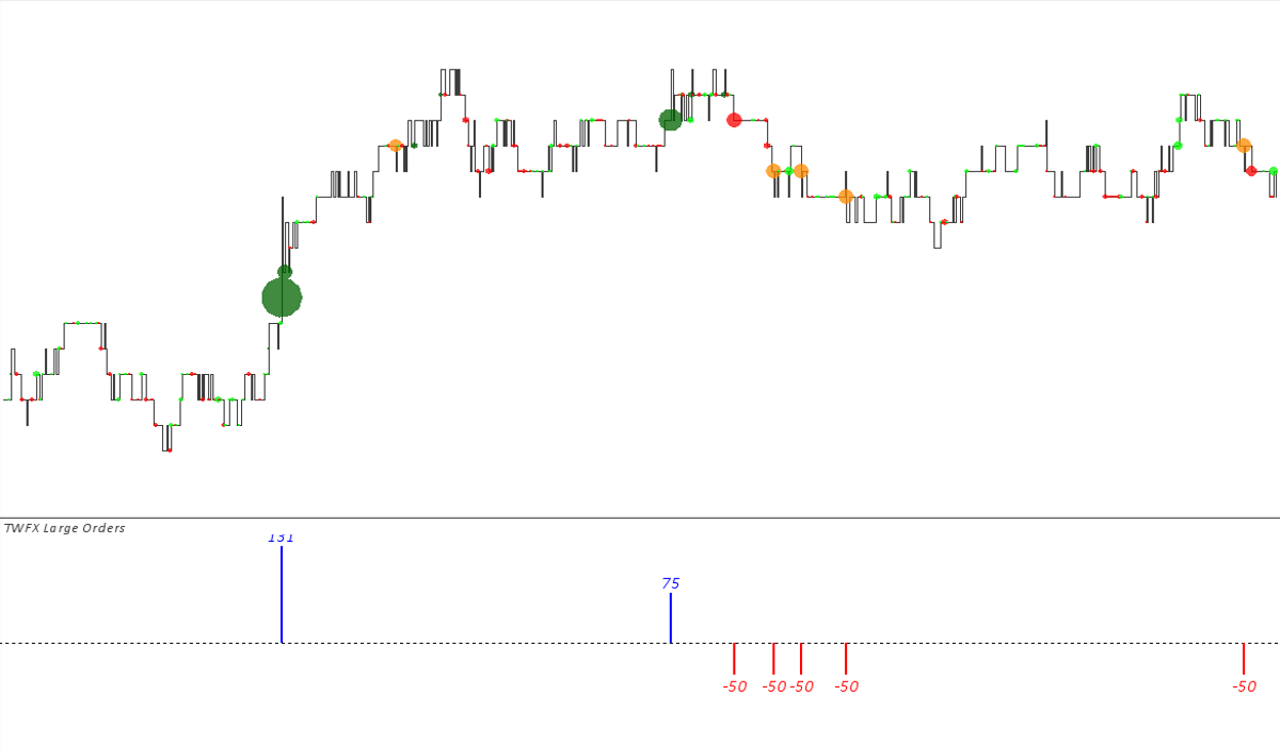
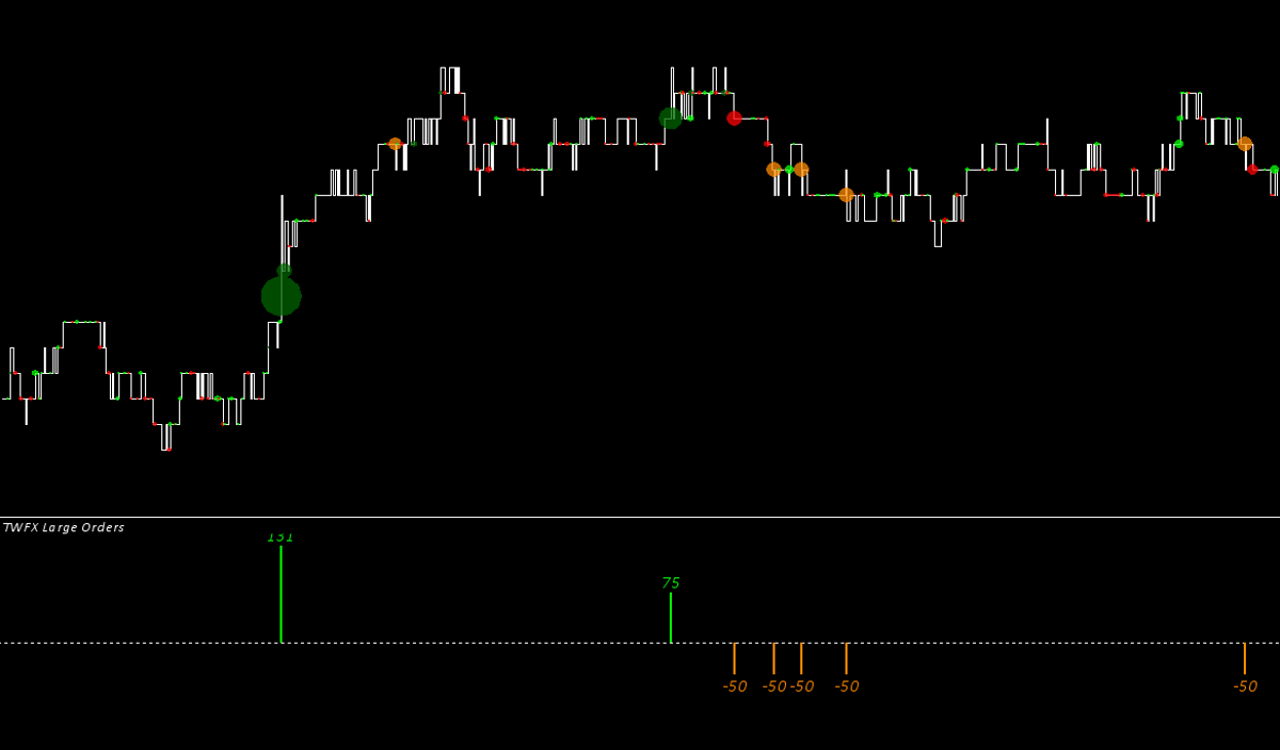
Large Orders
Display orders above a specific size in histogram format, large order filtering can be adjusted to suit the trade tape chart configuration.
- Play audible alert when threshold volume is exceeded
- Optional text display with volume filter
- Display independently or overlaid onto existing volume histogram
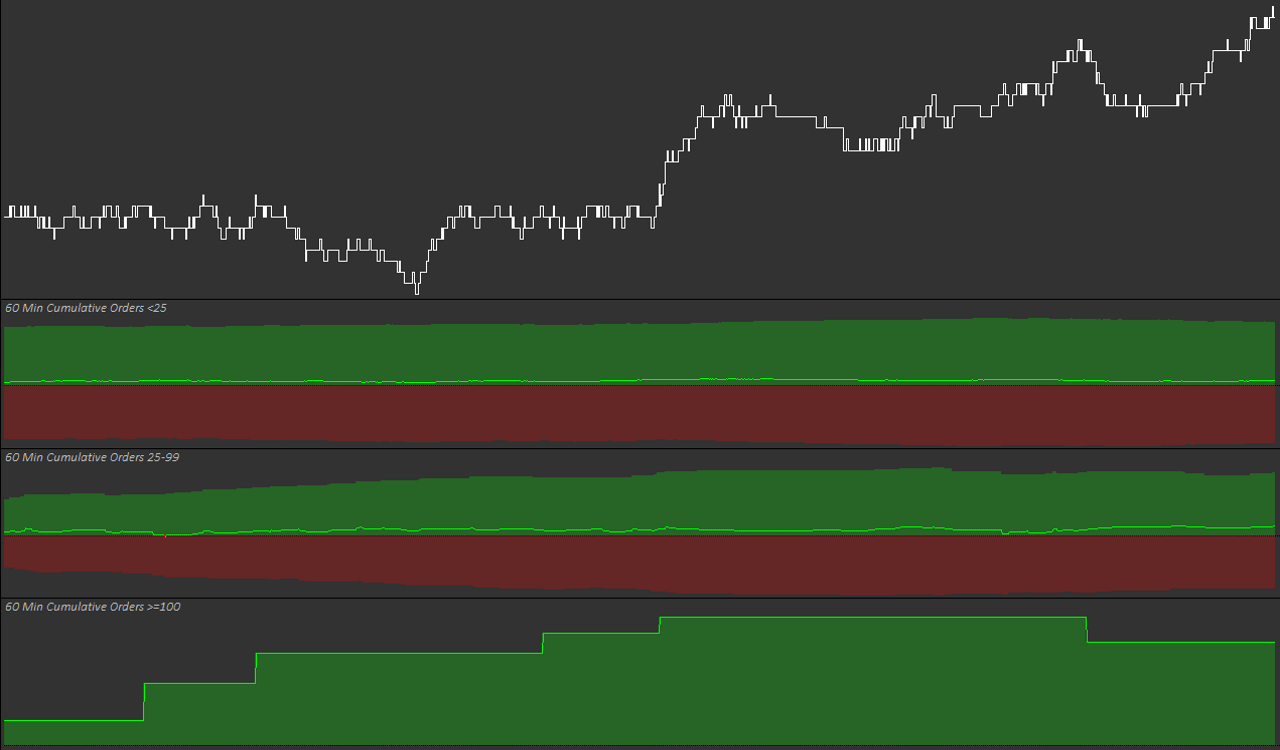
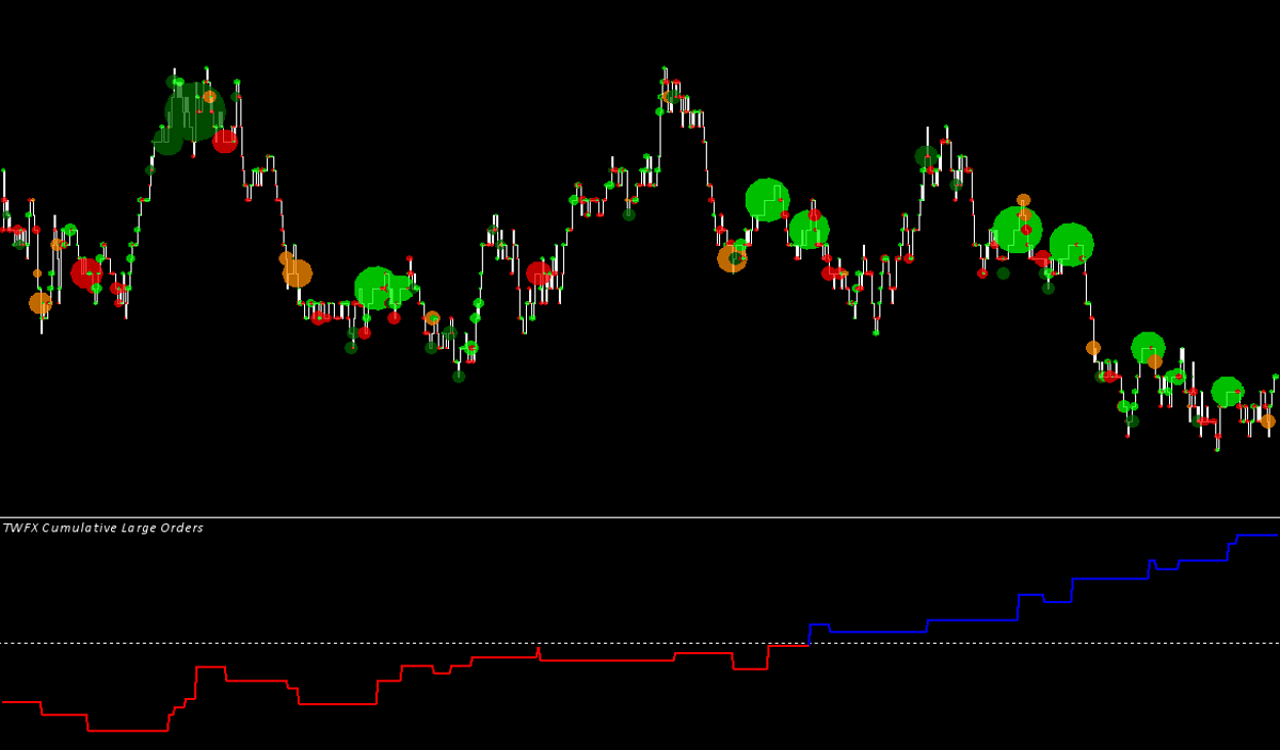
Cumulative Large Orders
Accumulate large orders (identified using the same methods as the Large Orders study) and display as a line graph.
- Choose from 3 different accumulation modes
- Reset the cumulative large order sum each day, trading session, or not at all
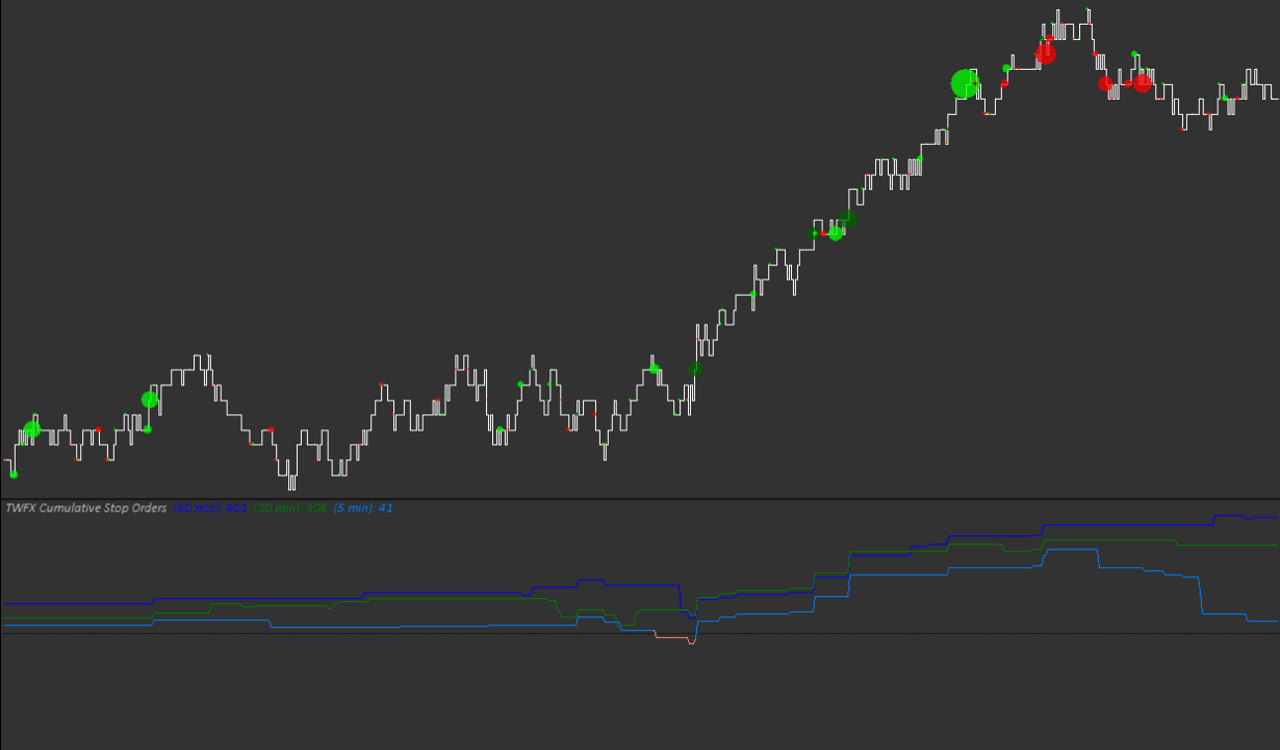
Cumulative Stop Orders
Accumulate stop orders (identified using the same methods as the Stop Orders study) and display as a line graph.
- 3 accumulation mode options to choose from
- 3 cumulative stop order sum reset options
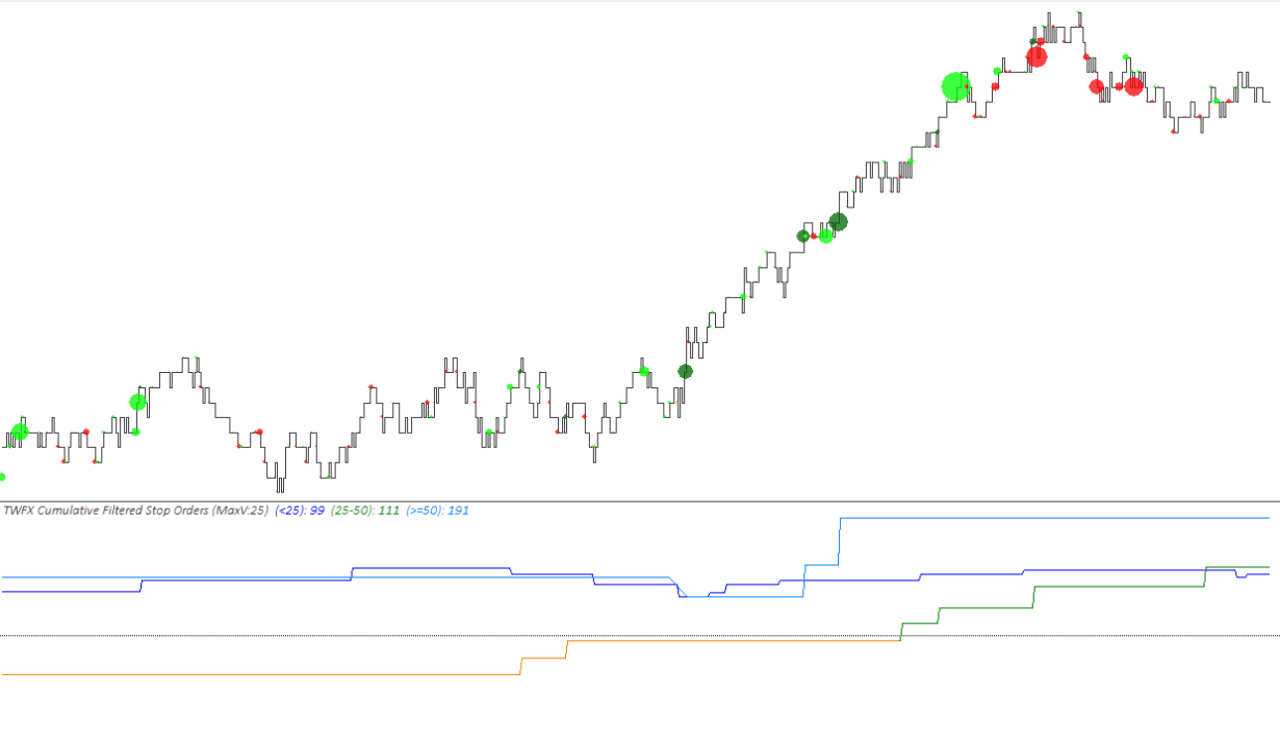
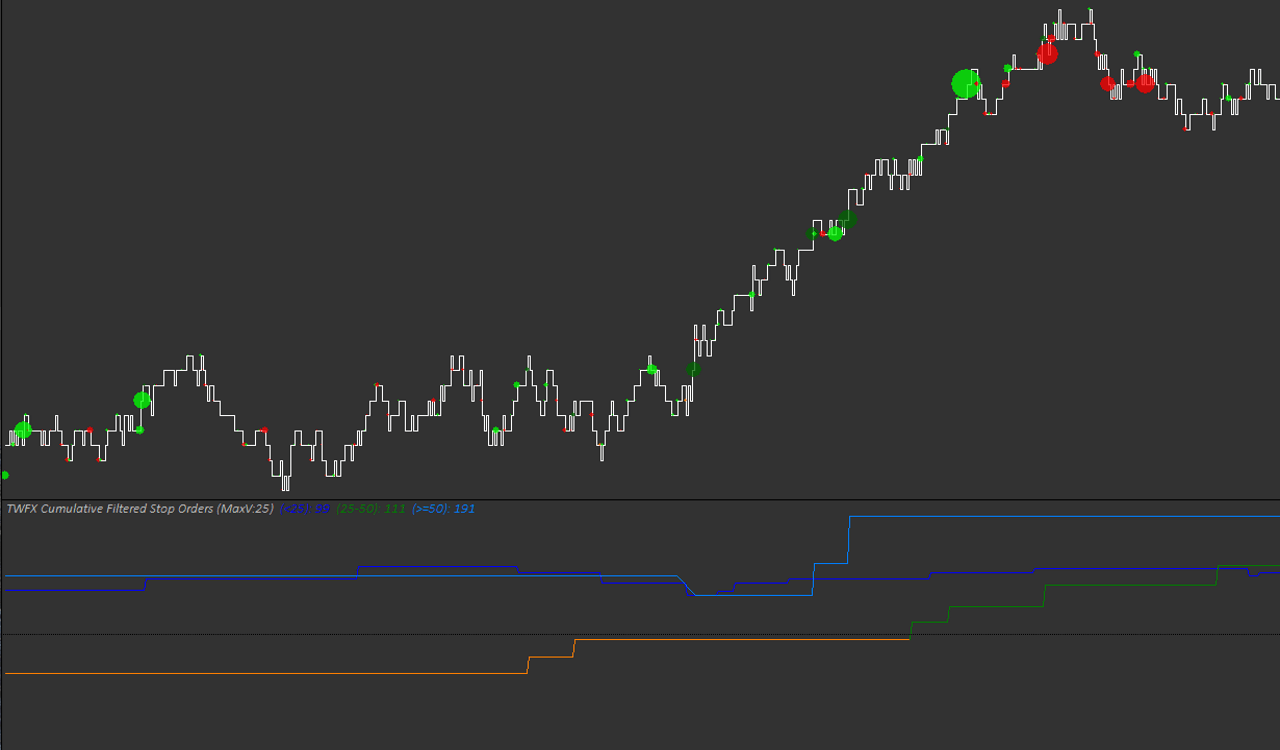
Cumulative Filtered Stop Orders
Accumulate stop orders similarly to the Cumulative Stop Orders study, with the additional option of filtering out stop orders above and/or below specified thresholds.
- 3 accumulation mode options to choose from
- 3 cumulative stop order sum reset options
- 3 accumulation mode options to choose from
- Reset the cumulative stop order sum each day, trading session, or not at all
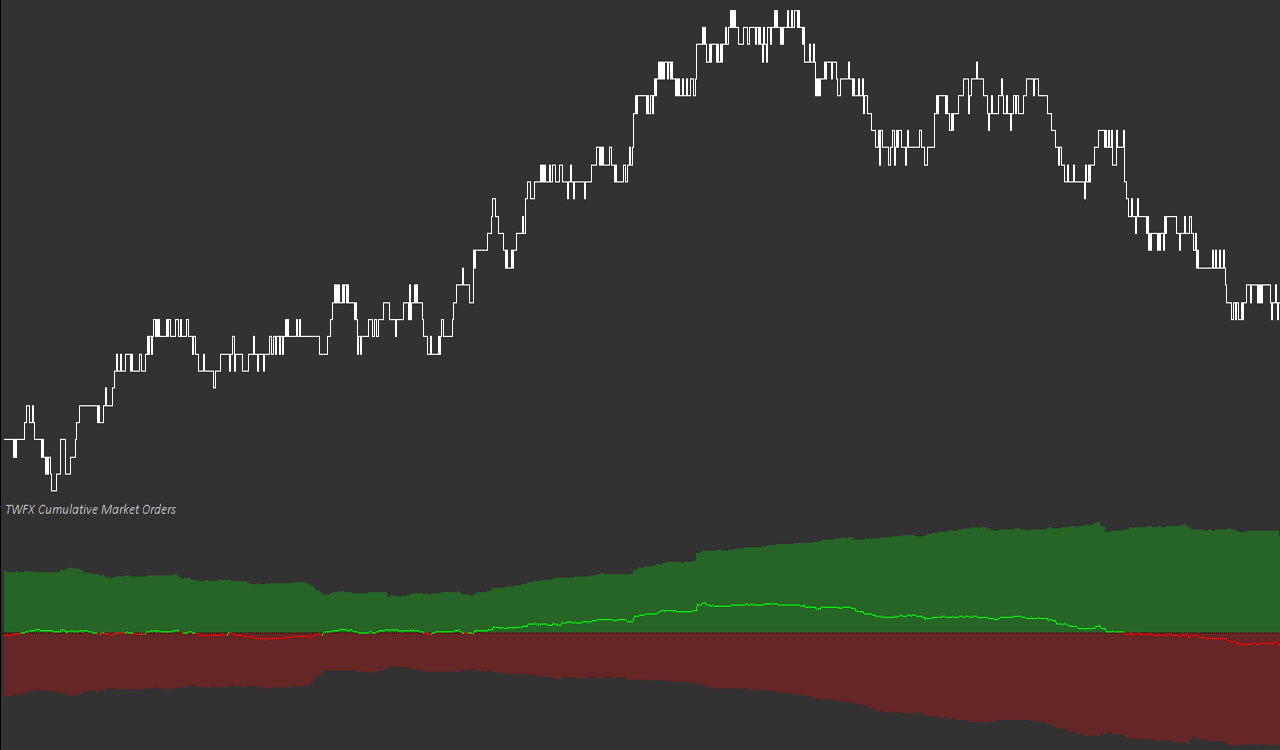
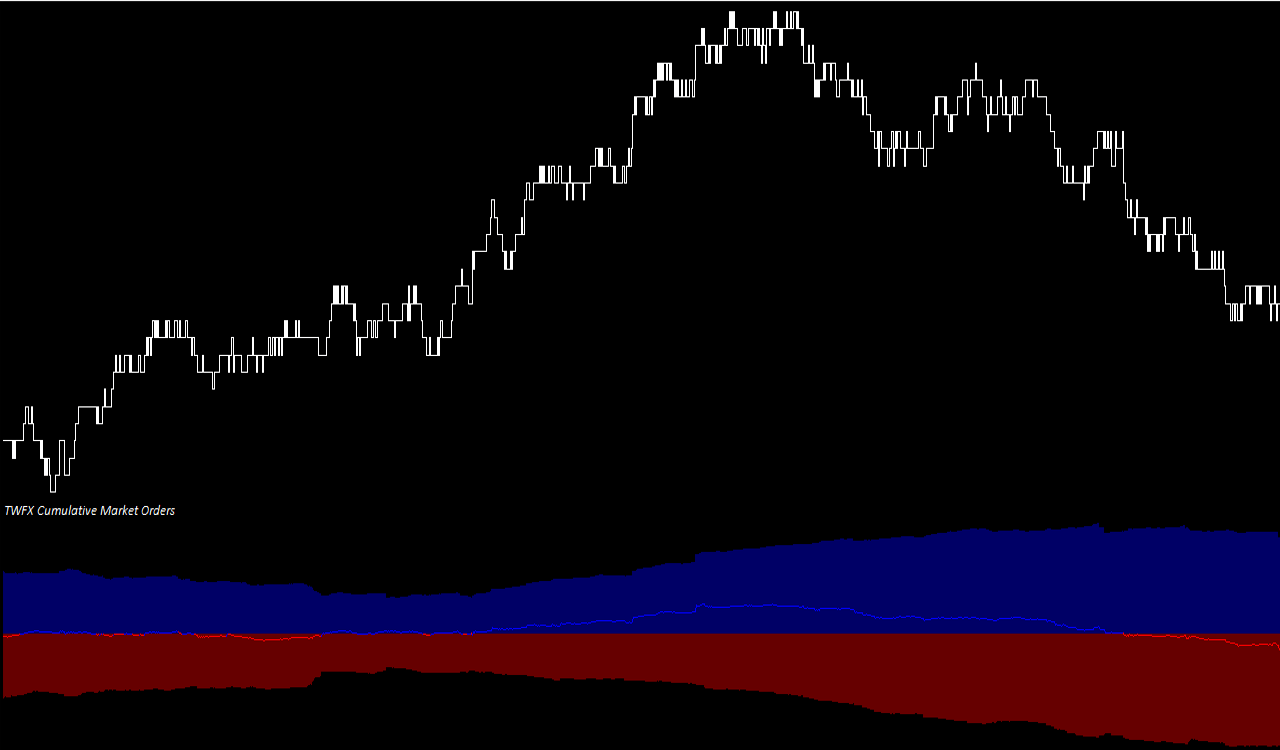
Cumulative Market Orders
Accumulate ask / bid orders based on user defined parameters and display as an area graph.
- 3 accumulation mode options to choose from
- 3 cumulative stop order sum reset options
- Optionally display ask / bid cumulative delta
Cumulative Filtered Market Orders
Accumulate orders similarly to the Cumulative Market Orders study, with the option to exclude trades above and/or below specified volume filter levels.
- 3 accumulation mode options to choose from
- 3 cumulative stop order sum reset options
- Optionally display ask / bid cumulative delta
- Choose from 3 accumulation mode options
- Reset the cumulative sum each day or trading session if required
- Optionally display the difference (delta) between the cumulative ask and bid volume
Reconstructing the Tape
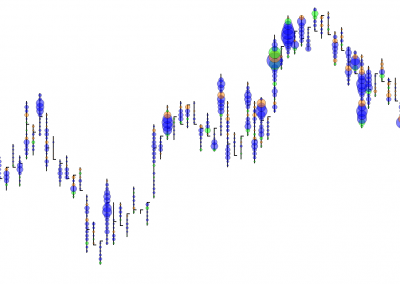
When building a custom chart from the time and sales data, different aggregation methods can used depending on the the level of detail required from the final chart. The Trade Tape Chart study provides four basic data processing / aggregation modes which can be further modified via volume filtering and time sensitivity. Using the available options, it is possible to build charts showing anything from individual market/limit orders to trade sequence summaries covering periods of upto 1 second.
The data processing modes available are: ‘Use Chart Setting Only’; ‘Same Time and Price’; ‘Same Time and Type’; and ‘Market Order’. When using the Sierra Chart Denali Exchange Data Feed with CME Group exchange traded products, Sierra Chart provides the option to ‘Combine Trades into Original Summary Trade‘, what this means is that when an aggressor (market) order trades against multiple limit orders (at the same price level), it will be recorded as a single larger trade, rather than mulitple smaller trades.
Use Chart Setting Only: Trades Not Combined (Raw Tape)
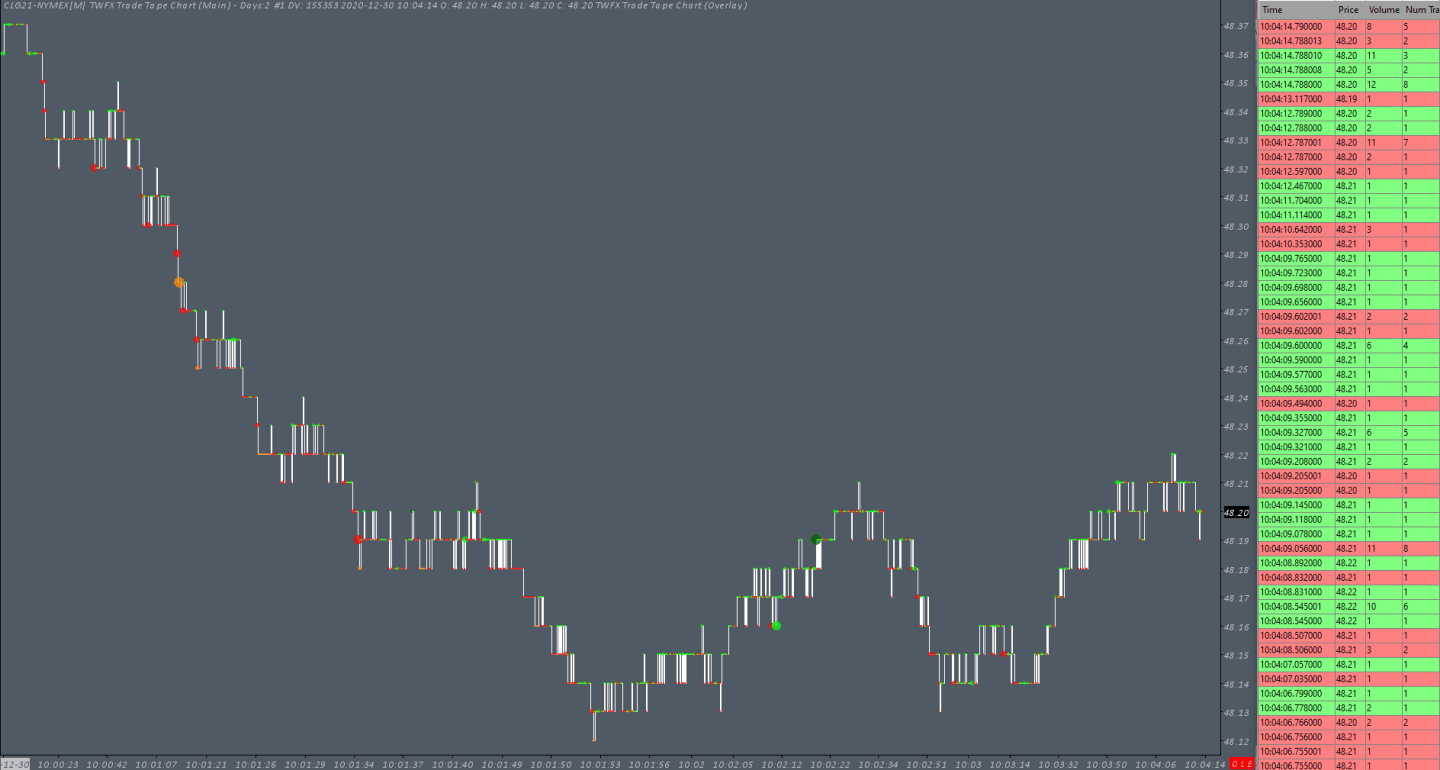
Use Chart Setting Only: Trades Combined (Reconstructed Tape)
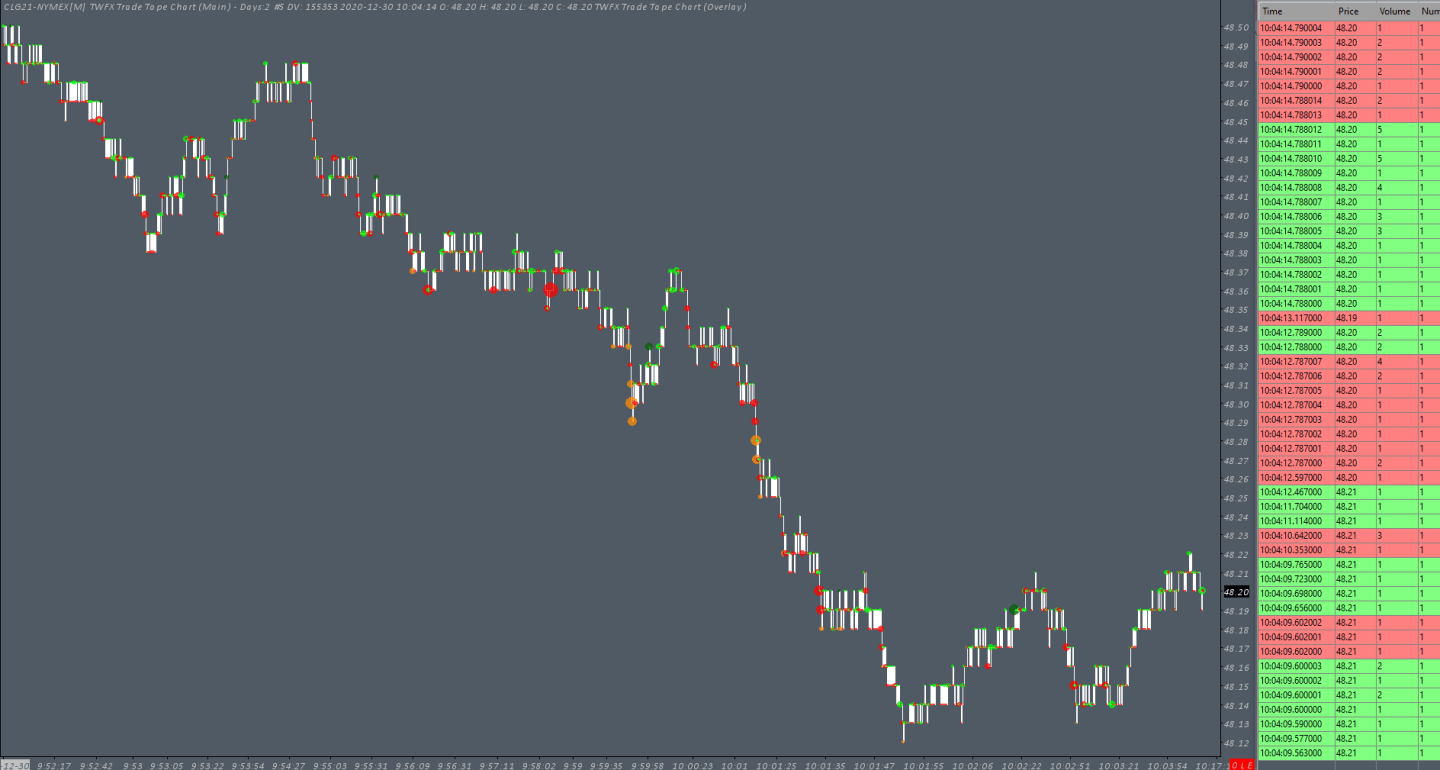
Same Time and Price (Summarized Tape)
Same Time and Type (Summarized Tape)
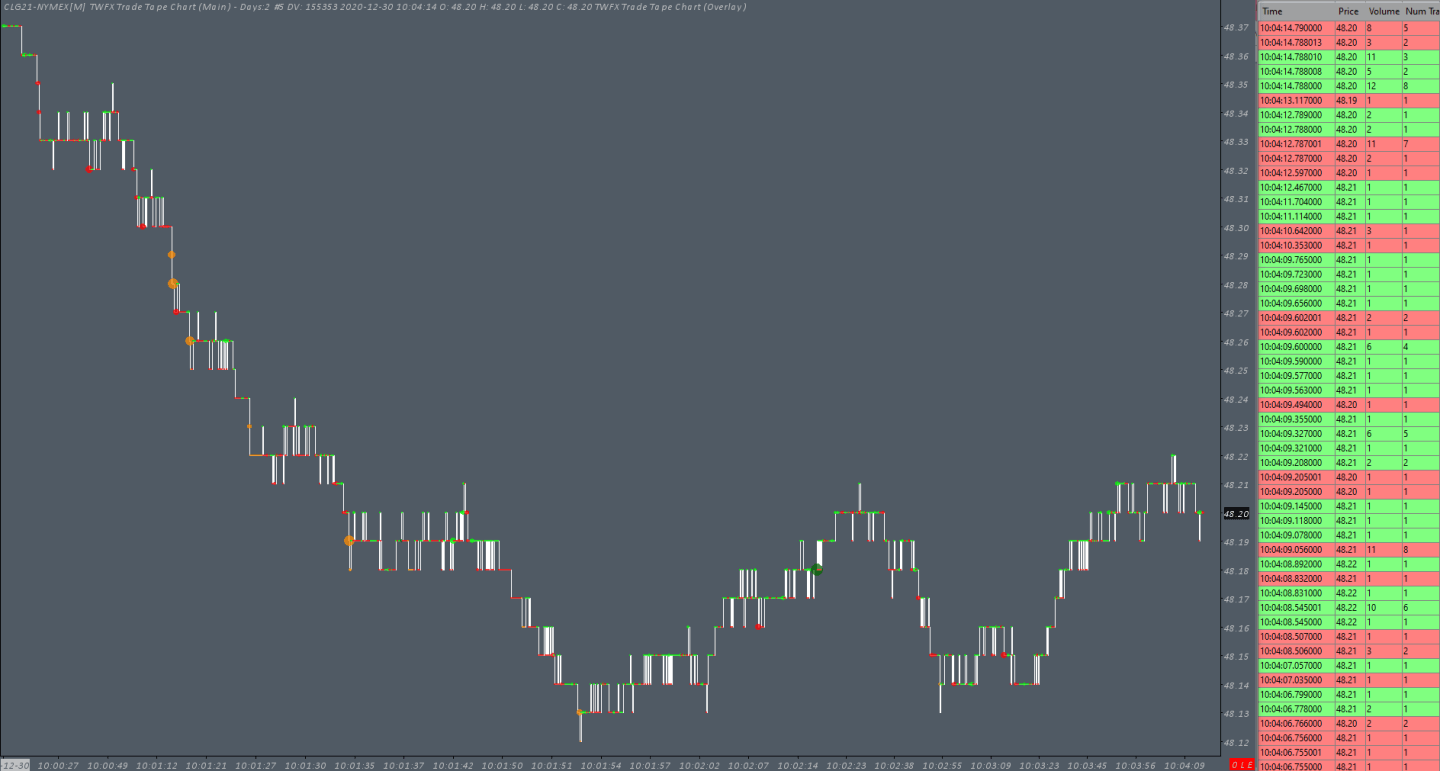
Market Order (Reconstructed Tape)
Where the ‘Combine Trades into Original Summary Trade’ option is not supported, or it unavailable for a particular product, either of the ‘Same Time and Price’ or ‘Same Time and Type’ combining / aggregation modes can be used as a reasonable analouge, provided the time window is configured to be sufficiently short.
Another use of these particular combining modes is to capture sequences of smaller trades, which could be either a larger market participant submitting multiple orders algorithmically or simply many smaller market participants. In both of these cases, a sequence of smaller orders may not stand out when each order is considered individually, however, when combined they almost certainly will, meaning that potentially significant information is made to be much more apparent.
Combining with Other Studies
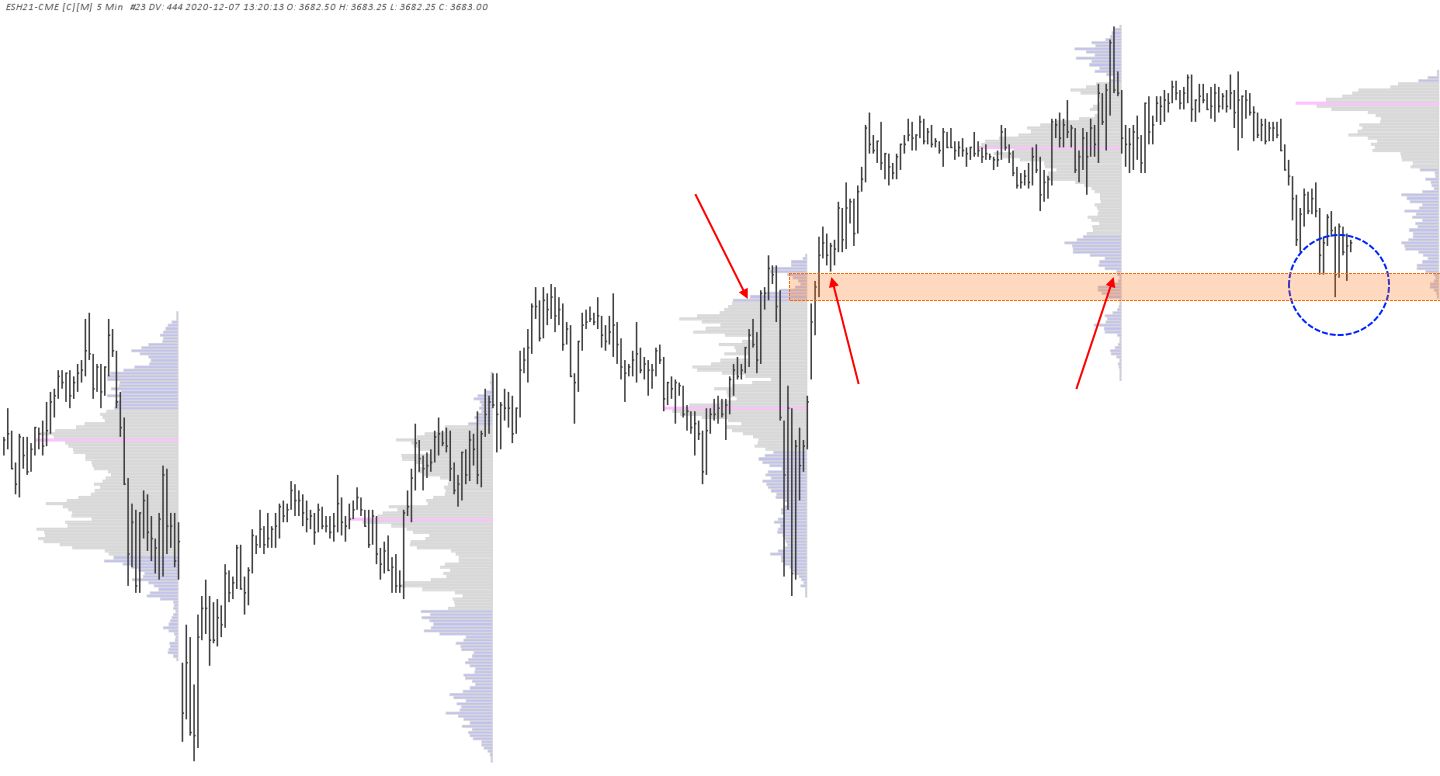
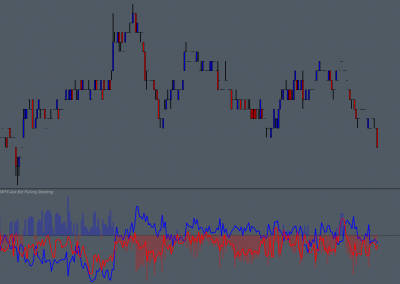
In addtion to the packaged support studies, some other examples of useful studies to combine with the trade tape chart are the Sierra Chart Market Depth Historical Graph, Cumulative Delta, and Cumulative Delta – Time Period. When used in conjunction with the Market Depth Historical Graph study the Reconstructed Tape Chart studies can be powerful tool for analyzing orderflow into areas of expected liquidity, this combined with other methods and knowledge can be helpful in identifying potential reversal locations and trade entries or exits.
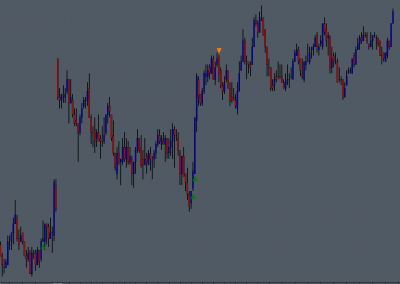
There are many ways to evaluate orderflow, liquidity and market behavior, using a choice of other methods and/or chart studies / indicators, but if you are not an expert tape (tima and sales) reader / DOM trader, visual representations of this same information can certainly help with more efficient evaluation and decision making.
visual representations of this same information can certainly help with more efficient evaluation…
0 Comments