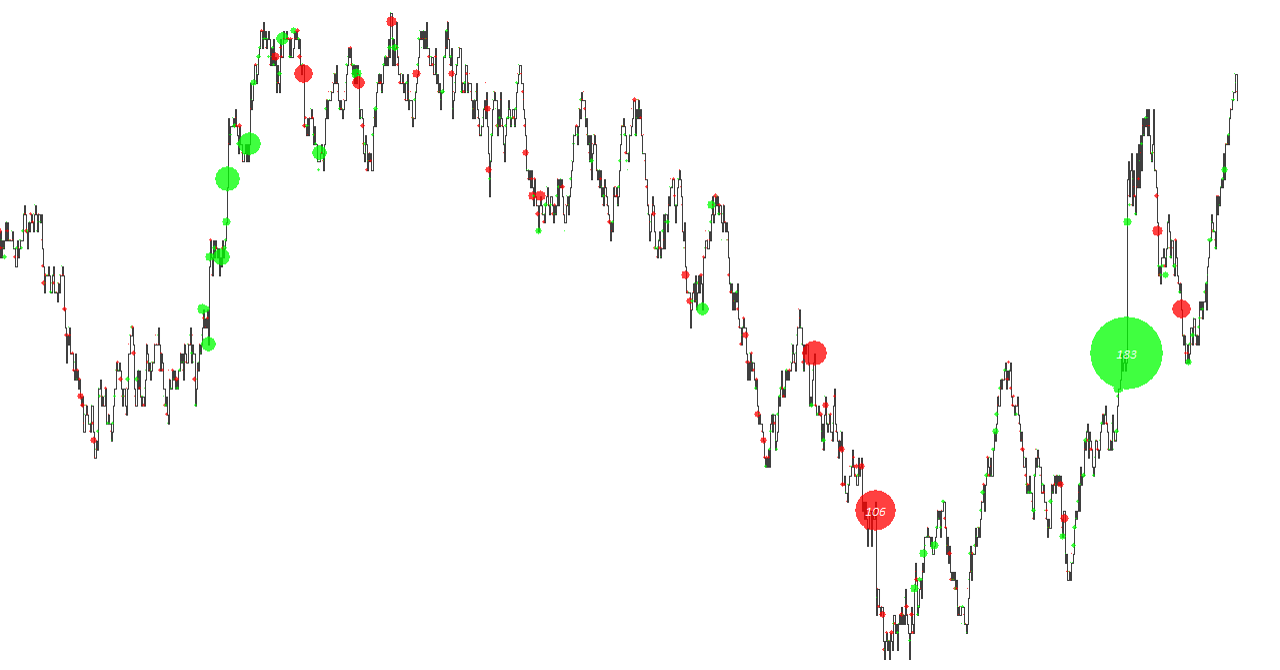
The Trade Tape Chart (Overlay) Study is designed specifically to be used with the Trade Tape Chart Study, the study provides additional order visualisation options, including price lines, trade markers and text display.
Various configuration options are provided to give flexibility in which information to display and how to display it.
The study is summarised in the following update post – Reconstructed Tape Chart.
Note:
- This study can only be used on charts with a chart data type of ‘Intraday Chart‘
- It is required to use ‘Intraday Data Storage Time Unit‘ setting ‘1 Tick’
- The study is designed specifically to be used in conjunction with the TWFX Trade Tape Chart study, it will not work in any other configuration.
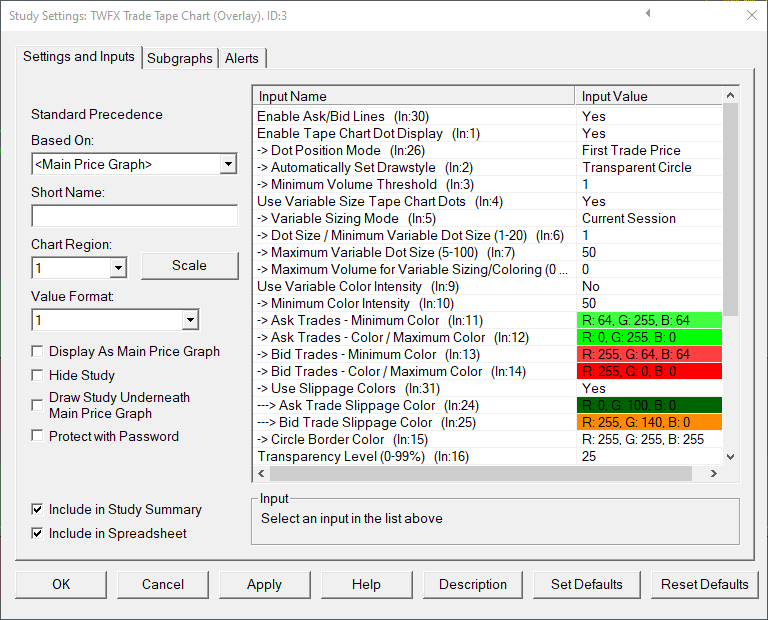
Inputs
Enable plotting of the last recorded Ask and Price prices for each chart bar; uses subgraphs 1 and 2.
Enable Tape Chart Dot Display (In:1)
Enable plotting of a trade markers, according to the specified parameters.
Dot Position Mode (In:26)
Defines the price at which to draw the trade marker.
- Trade Price / Average Trade Price:
If a trade transacts across more than one price level, then the average of the highest and lowest trade prices will be used as the trade marker price, otherwise the actual trade price will be used. - First Trade Price:
If a trade transacts across more than one price level, then the first traded price will be used as the trade marker price, otherwise the actual trade price will be used. - Last Trade Price:
If a trade transacts across more than one price level, then the last traded price will be used as the trade marker price, otherwise the actual trade price will be used.
Sets the drawstyle for the trade tape dots from a list of recommended options.
To use alternative options set to ‘No’ and select the desired drawstyle on the subgraphs tab of the study settings window.
Minimum Volume Threshold (In:3)
Defines the minimum trade volume required before a trade tape dot is displayed.
- Min: 1
- Max: 1000000
Use Variable Size Trade Tape Dots (In:4)
When enabled the trade tape dot sizing is determined according to the ‘Variable Sizing Mode’ and associated parameters, otherwise the ‘Dot Size / Minimum Variable Dot Size’ is used.
Variable Sizing Mode (In:5)
Defines the method for determining the Trade Tape dot size.
- Visible Range:
Variable Size for Trade Tape dots is calculated using only the bars within the time/x-axis visible range
NOTE: Trade Tape Dots that are within the visible time range, but beyond the visible price range are included in the calculation. - All Bars Included in Study Calculation:
The time range for the entire chart is used.
This can be controlled using the setting ‘Chart Settings->Use Number of Days to Load’ - Current Session:
Variable Size for Trade Tape Dots is calculated using the current trading session only (based on the session times for the chart to which the study is applied) - Fixed Size Range:
The size of the trade tape dot is calculated based upon the volume relative to the range between the ‘Minimum Volume Threshold’ and ‘Maximum Volume for Scaling/Coloring’.
If the volume exceeds the ‘Maximum Volume for Scaling/Coloring’ then the ‘Maximum Variable Dot Size’ parameter will used.
NOTE: If ‘Maximum Volume for Scaling/Coloring’ is not defined, or is less than ‘Minimum Volume Threshold’ then the Variable Sizing Mode will revert to ‘Visible Range’ mode.
NOTE: ‘Variable Sizing Based On’ also applies to ‘Variable Coloring’, when used.
Defines the trade tape dot size when ‘Use Variable Size Trade Tape Dots’ is disabled, otherwise defines the minimum size used when calculating the trade tape dot size.
- Min: 1
- Max: 20
Defines the maximum size used when calculating the trade tape dot size.
- Min: 5
- Max: 100
Maximum Volume for Variable Sizing/Coloring (In:8)
Defines the maximum volume used when calculating variable size or variable coloring trade tape dots. If the traded trade volume exceeds this value, it will be used in place of the actual volume.
Note: This setting is ignored if set to 0.
- Min: 0
- Max: 1000000
Use Variable Color Intensity (In:9)
When enabled, the trade tape dot color is calculated based upon the volume as a percentage of the highest volume trade tape dot (using the same methodology as the variable sizing calculation).
The actual color displayed is interpolated between the minimum and maximum colors.
Minimum Color Intensity (In:10)
The minimum color intensity value to be used when calculating interpolated colors.
- Min: 0%
- Max: 100%
Ask Trades – Minimum Color (In:11)
Defines the color used for ask trades having the lowest volume – the lower boundary color when calculating interpolated colors.
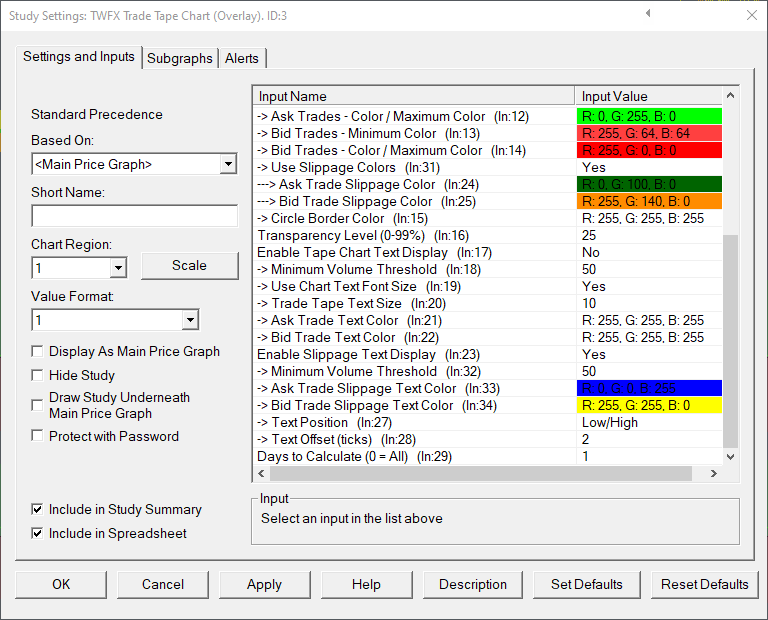
Ask Trades – Color / Maximum Color (In:12)
Defines the color used for ask trades having the highest volume – the upper boundary color when calculating interpolated colors.
Used for all ask trade tape dots when variable color intensity is disabled.
Bid Trades – Minimum Color (In:13)
Defines the color used for bid trades having the lowest volume – the lower boundary color when calculating interpolated colors.
Bid Trades – Color / Maximum Color (In:14)
Defines the color used for bid trades having the highest volume – the upper boundary color when calculating interpolated colors.
Used for all bid trade tape dots when variable color intensity is disabled.
Use Slippage Colors (In:31)
When this option is enabled, trades that occur above (or partially above) the last updated best ask or below (or partially below) the last updated best bid are displayed using the specified slippage colors, instead of the standard ask and bid colors.
Ask Trade Slippage Color (In:24)
Defines the color used for trade tape dots where the trade has occurred above the last updated best ask price.
Bid Trade Slippage Color (In:25)
Defines the color used for trade tape dots where the trade has occurred below the last updated best bid price.
Circle Border Color (In:15)
Applies to ‘Circle with Border’ drawstyle only.
Transparency Level (0-99%) (In:16)
Set the transparency level used when drawing trade tape dots.
Using transparency in conjunction with variable coloring is not recommended, as it can make the variable color graduations much less apparent.
Enable Trade Tape Text Display (In:17)
When enabled, text showing the actual trade volume can be displayed in addition to (or instead of) the trade tape dots.
Minimum Volume Threshold (In:18)
Defines the minimum trade volume required before trade tape text is displayed.
- Min: 0
- Max: 100000
Use Chart Text Font Size (In:19)
Automatically set the trade tape text size based on the chart font.
This setting is ignored when using OpenGL graphics and instead the ‘Trade Tape Text Size’ input is always used.
Trade Tape Text Size (In:20)
Defines the font size (in pixels) used when displaying the trade tape text display.
- Min: 5
- Max: 20
Ask Trade Text Color (In:21)
Defines the text color used for ask trades.
Bid Trade Text Color (In:22)
Defines the text color used for bid trades.
Enable Slippage Text Display (In:23)
When enabled, text showing the actual volume that has traded above the best ask or below the best bid is displayed above or below the corresponding chart bar.
Minimum Volume Threshold (In:32)
Defines the minimum slippage volume required before trade tape slippage text is displayed.
- Min: 0
- Max: 1000000
Ask Trade Slippage Text Color (In:33)
Defines the text color used for ask trade slippage volume
Bid Trade Slippage Text Color (In:34)
Defines the text color used for bid trade slippage volume
Text Position (In:27)
Defines the display position for slippage text
- Low:
Slippage text is displayed below the low of the corresponding chart bar, offset by the ‘Text Offset (ticks)’ value. - High:
Slippage text is displayed above the high of the corresponding chart bar, offset by the ‘Text Offset (ticks)’ value. - Low/High:
Slippage text is displayed above the high of buy (ask) trades and below the low of sell (bid) trades, offset by the ‘Text Offset (ticks)’ value.
Text Offset (ticks) (In:28)
Defines the text offset distance from the high or low, measured in ticks.
- Min: 0
- Max: 20
Days to Calculate (0 = All) (In:29)
Defines the number of days over which the study is calculated, can be used to reduce the initial study calculation time when many days worth of data is loaded into the chart but this study is only required to be shown on the most recent days.
- Min: 0 (in which case all loaded bars are evaluated during the study calculation)
- Max: 1000000
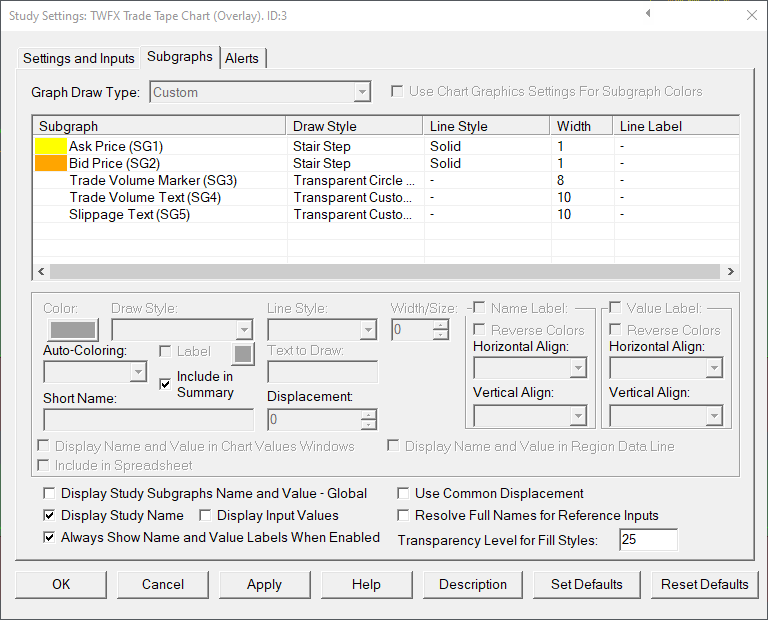
Subgraphs
Ask Price (SG1)
Default: Stair Step
Plots the last updated best ask price when each trade takes place.
Bid Price (SG2)
Default: Stair Step
Plots the last updated best bid price when each trade takes place.
Trade Volume Marker (SG3)
Plots the trade tape dots, when enabled, using the drawstyle defined by the ‘Automatically Set Drawstyle’ setting.
Trade Volume Text (SG4)
Plots the trade tape text display, when enabled, using the font size and colors defined by the ‘Trade Tape Text Size’, ‘Ask Trade Text Color’ & ‘Bid Trade Text Color’ settings.
Slippage Text (SG5)
Plots the trade tape text display, when enabled, using the font size and colors defined by the ‘Trade Tape Text Size’, ‘Ask Trade Text Color’ & ‘Bid Trade Text Color’ settings.