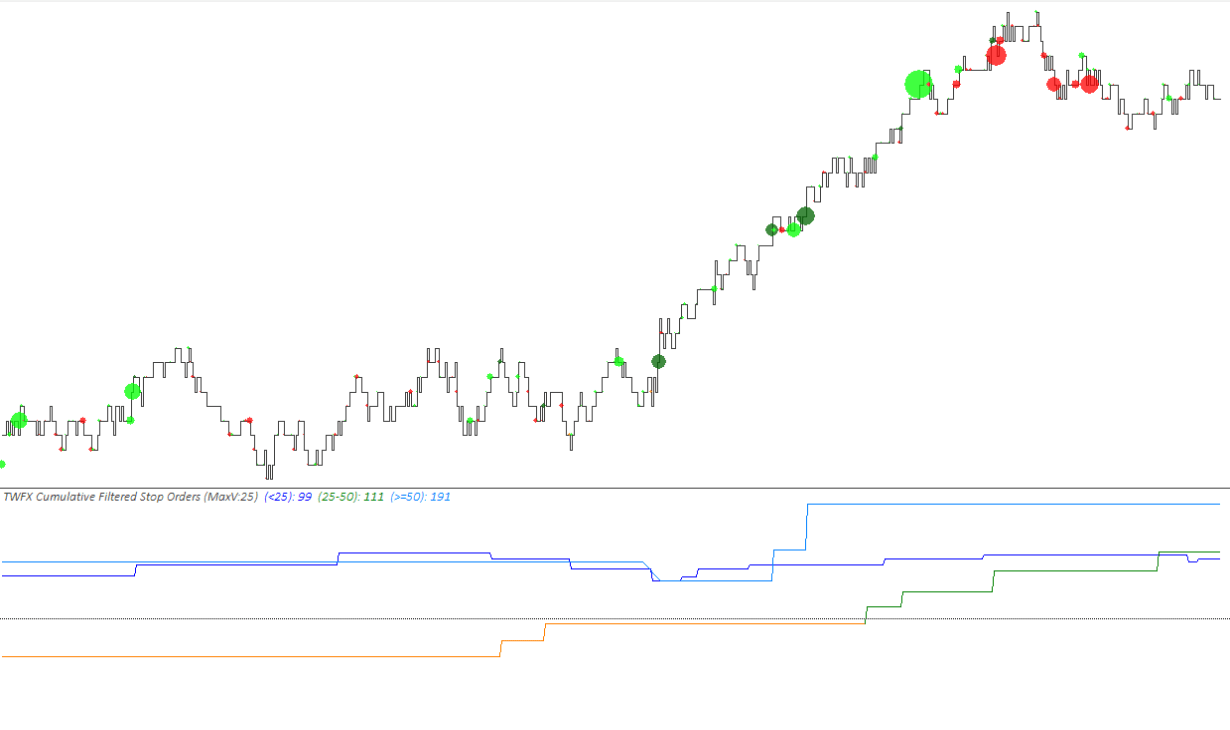
The Cumulative Filtered Stop Orders Study is designed specifically to be used with the Trade Tape Chart (Main) Study, the study provides an alternative means for displaying the ask volume that has transacted above the best ask price, or bid volume that has transacted below the best bid price.
Note: The Cumulative Filtered Stop Orders Study should not be considered to be 100% accurate in determining actual stop orders, as they can only be inferred from market order behavior. A filter is included so that the method for counting stop orders can be adjusted depending on requirements.
The study provides different methods for determining the cumulative sum and options for when it should be reset.
The study is summarised in the following update post – Reconstructed Tape Chart.
Note:
- This study can only be used on charts with a chart data type of ‘Intraday Chart‘
- It is required to use ‘Intraday Data Storage Time Unit‘ setting ‘1 Tick’
- The study is designed specifically to be used in conjunction with the TWFX Trade Tape Chart study, it will not work in any other configuration.
Inputs
Calculation Mode (In:1)
Defines the method used when determining the cumulative sum.
For the purposes of the cumulative sum, Ask (Buy) Stop orders are treated as positive, whereas Bid (Sell) Stop orders are threated as negative.
- Continuous:
Stop orders are accumulated continuously, or until it is reset at the either at the beginning of each trading day or session, as determined by the ‘Cumulative Reset’ input. - Time Period – Rolling:
Stop orders are accumulated in a continuous rolling sum, covering only the most recent ‘Accumulation Time Period’, the cumulative sum may also be reset at the beginning of each trading day or session, as determined by the
‘Cumulative Reset’ input. - Time Period – Fixed:
Stop orders are accumulated over a fixed time period, as determined by the ‘Accumulation Time Period’, after which it is reset to zero and the accumulation restarts. The cumulative sum may also be reset at the beginning of each trading day or session, as determined by the ‘Cumulative Reset’ input.
Accumulation Time Period (minutes) (In:2)
Defines the accumulation time period, measured in minutes, used for ‘Time Period – Rolling’ and ‘Time Period – Fixed’ calculation modes.
- Min: 1
- Max: 1440
Cumulative Reset (In:3)
Defines if / when the cumulative stop order sum should be reset (in additon to any Time Period based reset).
- None:
Cumulative sum is not reset (does not apply to ‘Time Period – Fixed’ calculation mode). - Day:
Cumulative sum is reset at the beginning of each trading day, as determined by the chart session times settings. - Session:
Cumulative sum is reset at the beginning of each trading session, as determined by the chart session times settings.
Enable Volume Filtering (In:4)
When enabled, this setting will allow stop orders, to be filtered according to the ‘Volume <=’ and ‘Volume >=’ conditions.
Volume <= (In:5)
Defines the minimum stop order filter value.
- Min: 0 (0 = Ignore)
- Max: 1000000
Volume >= (In:6)
Defines the maximum stop order filter value.
- Min: 0 (0 = Ignore)
- Max: 1000000
Filtering Mode (In:8)
- None:
The total volume for any chart bar having volume traded above (below) the best ask (bid) is counted as stop order volume. - Exclude Trade at Best Ask/Bid:
Only volume that has traded above (below) the best ask (bid) is counted as stop order volume. - Exclude Large Market Orders:
Volume that has traded above (below) the best ask (bid) is counted as stop order volume, only if the order has not been interpreted as a single market order trading across multiple price levels.
NOTE: For “Exclude Large Market Orders” to function correctly, the use of a Sierra Chart provided data feed is required and the “Combine Trades into Original Summary Trade” option must be enabled, refer to the following for more information – https://www.sierrachart.com/index.php?page=doc/ChartSettings.html#CombineTradesIntoOriginalSummaryTrade.
Days to Calculate (0 = All) (In:7)
Defines the number of days over which the study is calculated, can be used to reduce the initial study calculation time when many days worth of data is loaded into the chart but this study is only required to be shown on the most recent days.
- Min: 0 (in which case all loaded bars are evaluated during the study calculation)
- Max: 1000000
Subgraphs
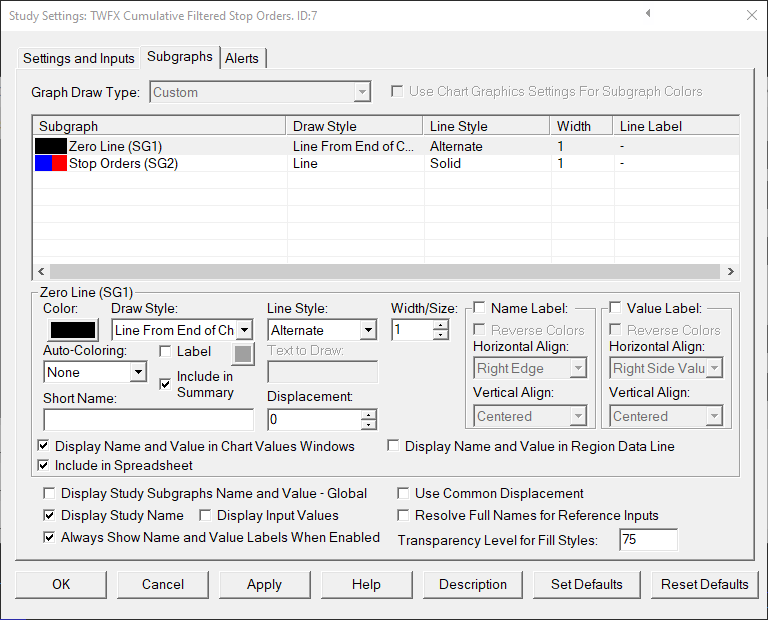
Zero Line (SG1)
Default: Line Extend to Edge
Displays horizontal axis at zero to suit zero centered subgraph display.
Stop Orders (SG2)
Default: Line
Displays the accumulated stop orders