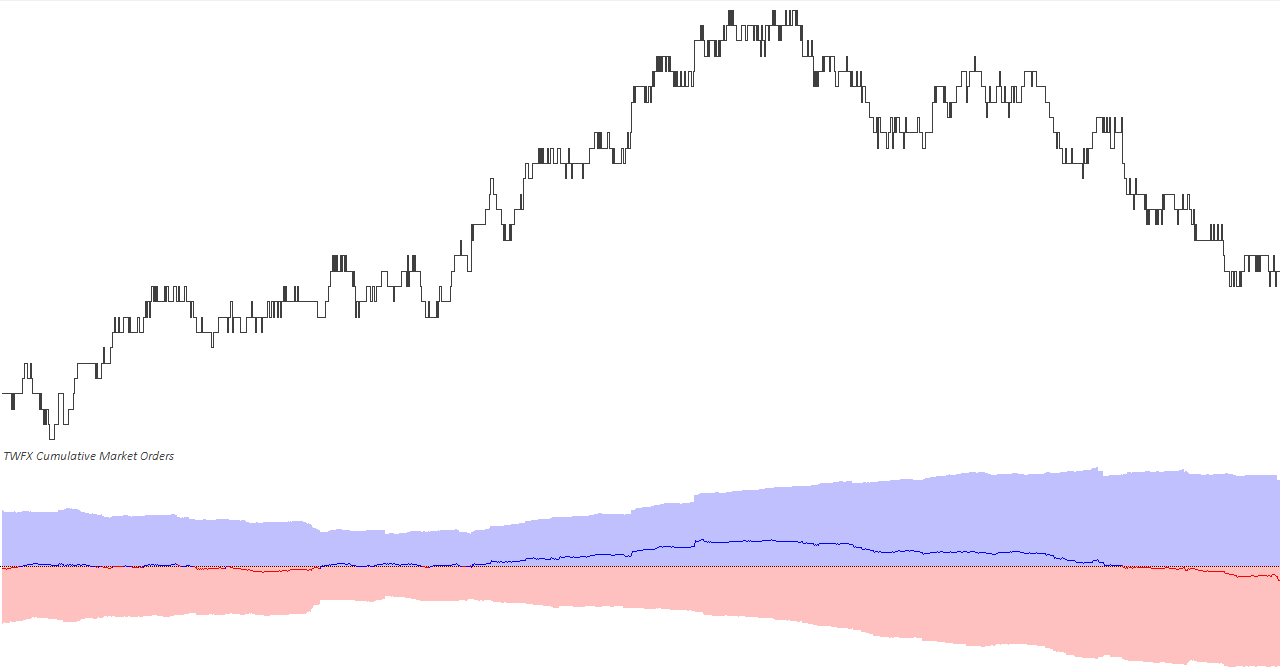
The Cumulative Market Orders Study tracks and accumulates ask and bid traded volume, and then displays an area graph for each, bid volume being shown as negative. The study also offers the option to display the difference (delta) between the ask and bid volumes.
When used in conjunction with the TWFX Trade Tape Chart Study, ask and bid volume equates to market orders as determined by the parameters of Trade Tape Chart, and as such will not necessariliy respresent the total traded ask and bid volume.
The study provides different methods for determining the cumulative sum and options for when it should be reset.
The study is summarised in the following update post – Reconstructed Tape Chart.
Note:
- This study can only be used on charts with a chart data type of ‘Intraday Chart‘
- It is required to use ‘Intraday Data Storage Time Unit‘ setting ‘1 Tick’
- The study is designed specifically to be used in conjunction with the TWFX Trade Tape Chart study, however it is not limited to being used in this configuration.
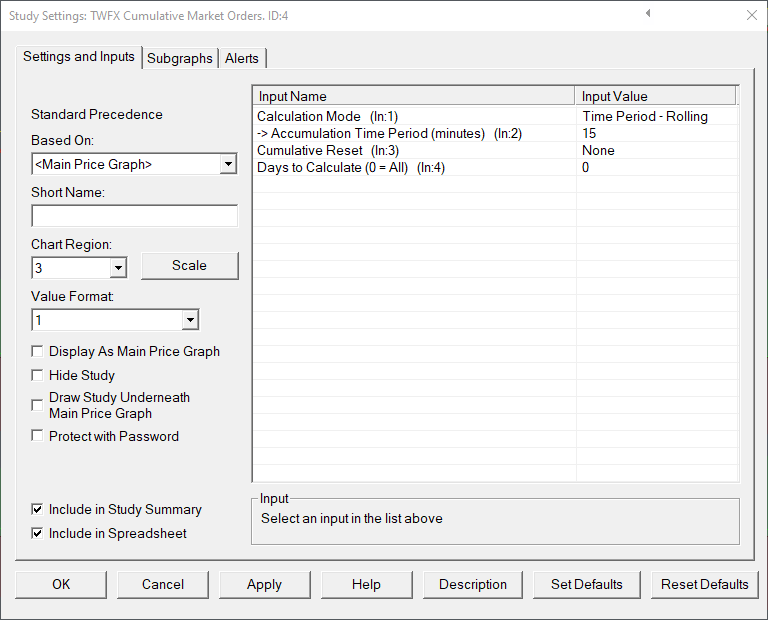
Inputs
Calculation Mode (In:1)
Defines the method used when determining the cumulative sum.
- Continuous:
Ask and Bid volume is accumulated continuously, or until it is reset at the either at the beginning of each trading day or session, as determined by the ‘Cumulative Reset’ input. - Time Period – Rolling:
Ask and bid volume is accumulated in a continuous rolling sum, covering only the most recent ‘Accumulation Time Period’, the cumulative sum may also be reset at the beginning of each trading day or session, as determined by the ‘Cumulative Reset’ input. - Time Period – Fixed:
Ask and Bid volume is accumulated over a fixed time period, as determined by the ‘Accumulation Time Period’, after which it is reset to zero and the accumulation restarts. The cumulative sum may also be reset at the beginning of each trading day or session, as determined by the ‘Cumulative Reset’ input.
Accumulation Time Period (minutes) (In:2)
Defines the accumulation time period, measured in minutes, used for ‘Time Period – Rolling’ and ‘Time Period – Fixed’ calculation modes.
- Min: 1
- Max: 1440
Cumulative Reset (In:3)
Defines if / when the cumulative volume sum should be reset (in additon to any Time Period based reset).
- None:
Cumulative sum is not reset (does not apply to ‘Time Period – Fixed’ calculation mode). - Day:
Cumulative sum is reset at the beginning of each trading day, as determined by the chart session times settings. - Session:
Cumulative sum is reset at the beginning of each trading session, as determined by the chart session times settings.
Days to Calculate (0 = All) (In:4)
Defines the number of days over which the study is calculated, can be used to reduce the initial study calculation time when many days worth of data is loaded into the chart but this study is only required to be shown on the most recent days.
- Min: 0 (in which case all loaded bars are evaluated during the study calculation)
- Max: 1000000
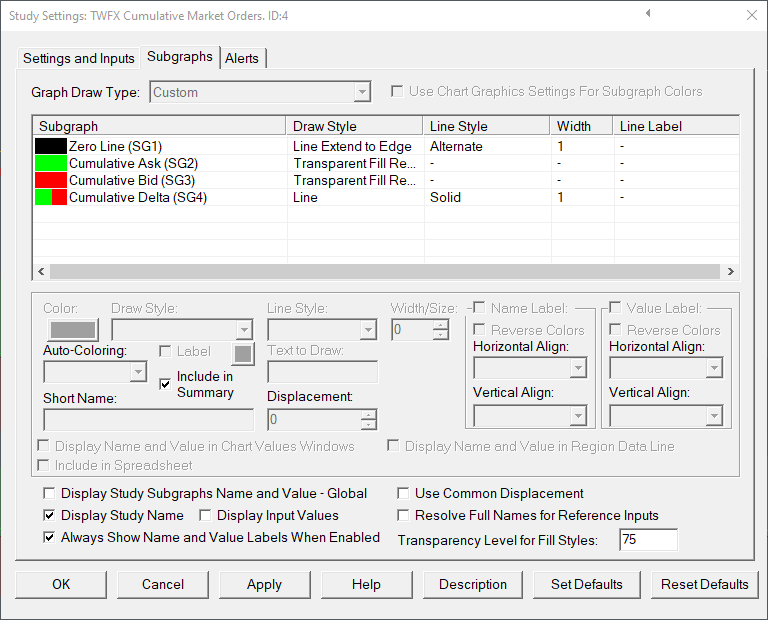
Subgraphs
Zero Line (SG1)
Default: Line Extend to Edge
Displays horizontal axis at zero to suit zero centered subgraph display.
Cumulative Ask (SG2)
Default: Transparent Fill Rectangle to Zero
Displays accumulated ask volume.
Cumulative Bid (SG3)
Default: Transparent Fill Rectangle to Zero
Displays accumulated bid volume (negative).
Cumulative Delta (SG4)
Default: Line
Displays the difference (delta) bewteen the cumulative ask and cumulative bid volumes.