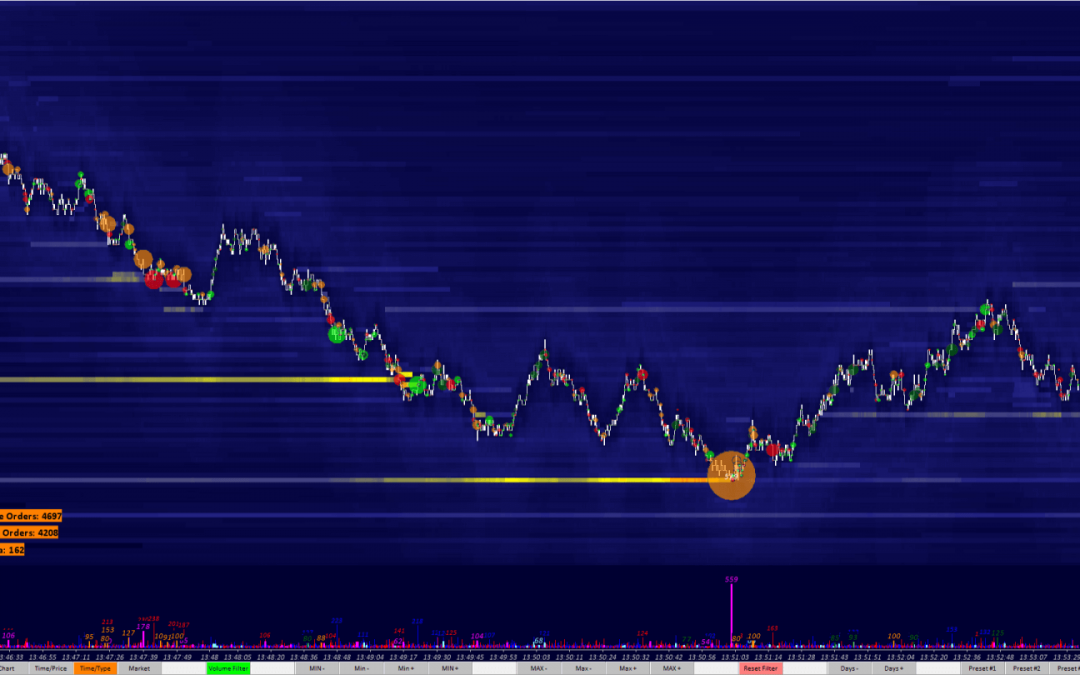
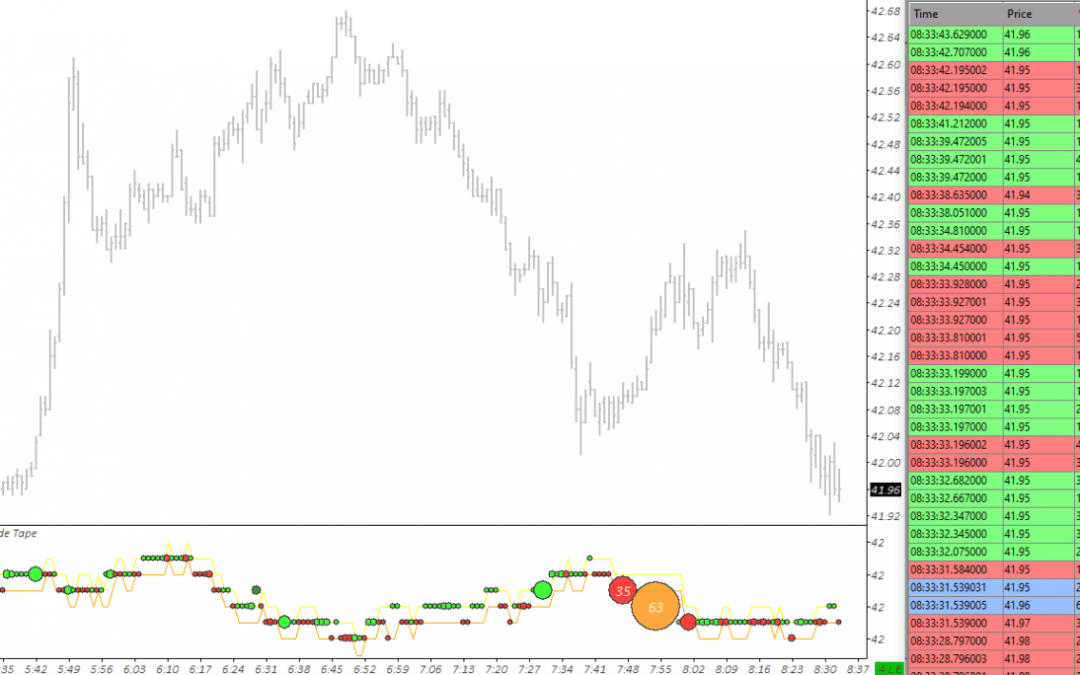
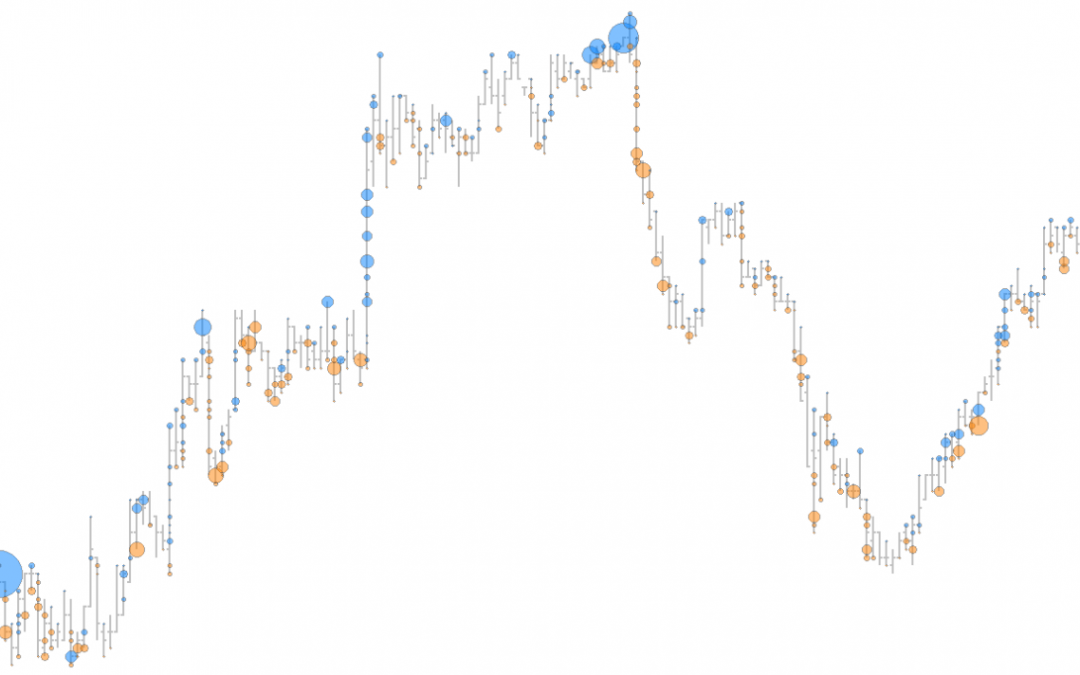
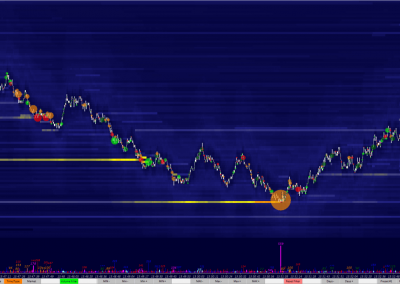
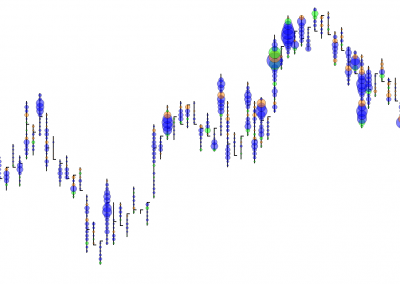
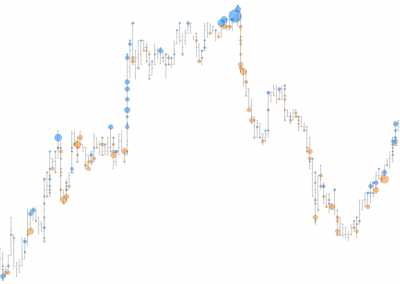
Sierra Chart Reconstructed Tape Chart Study: Build a custom chart from time & sales data / orderflow; Choose the aggregation mode; Filter using trade volume; Visualize relative order sizes using volume dot display; Display large orders and stop orders.