TWFX Reconstructed Tape Chart
What's Included?
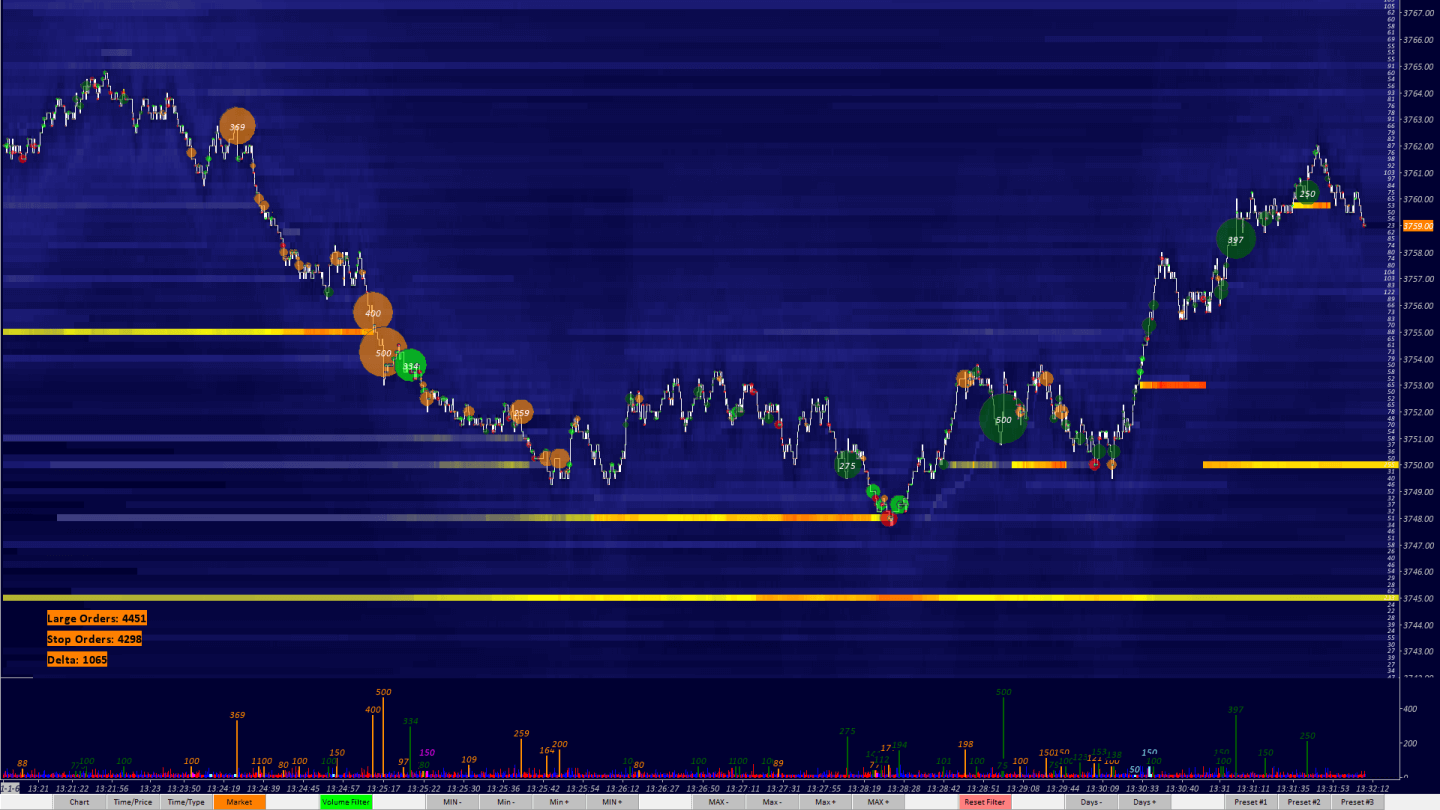
The TWFX Reconstructed Tape Chart Study is a collection of studies provided for the purpose of visualizing time & sales order flow. The foundation of the study package is the Trade Tape Chart custom chart building study, this study is used to create the custom chart view based on orderflow. Options to control order aggregation and volume filtering are provided, allowing the chart view to be customized depending on individual requirements.
In addition to the main custom chart building study, several support studies, specifically designed for use with the Trade Tape Chart, are also included to further help with order flow visualisation.
The following studies are including as part of the TWFX Reconstructed Tape Chart Study package –
- TWFX Trade Tape Chart (Main)
- TWFX Trade Tape Chart (Overlay)
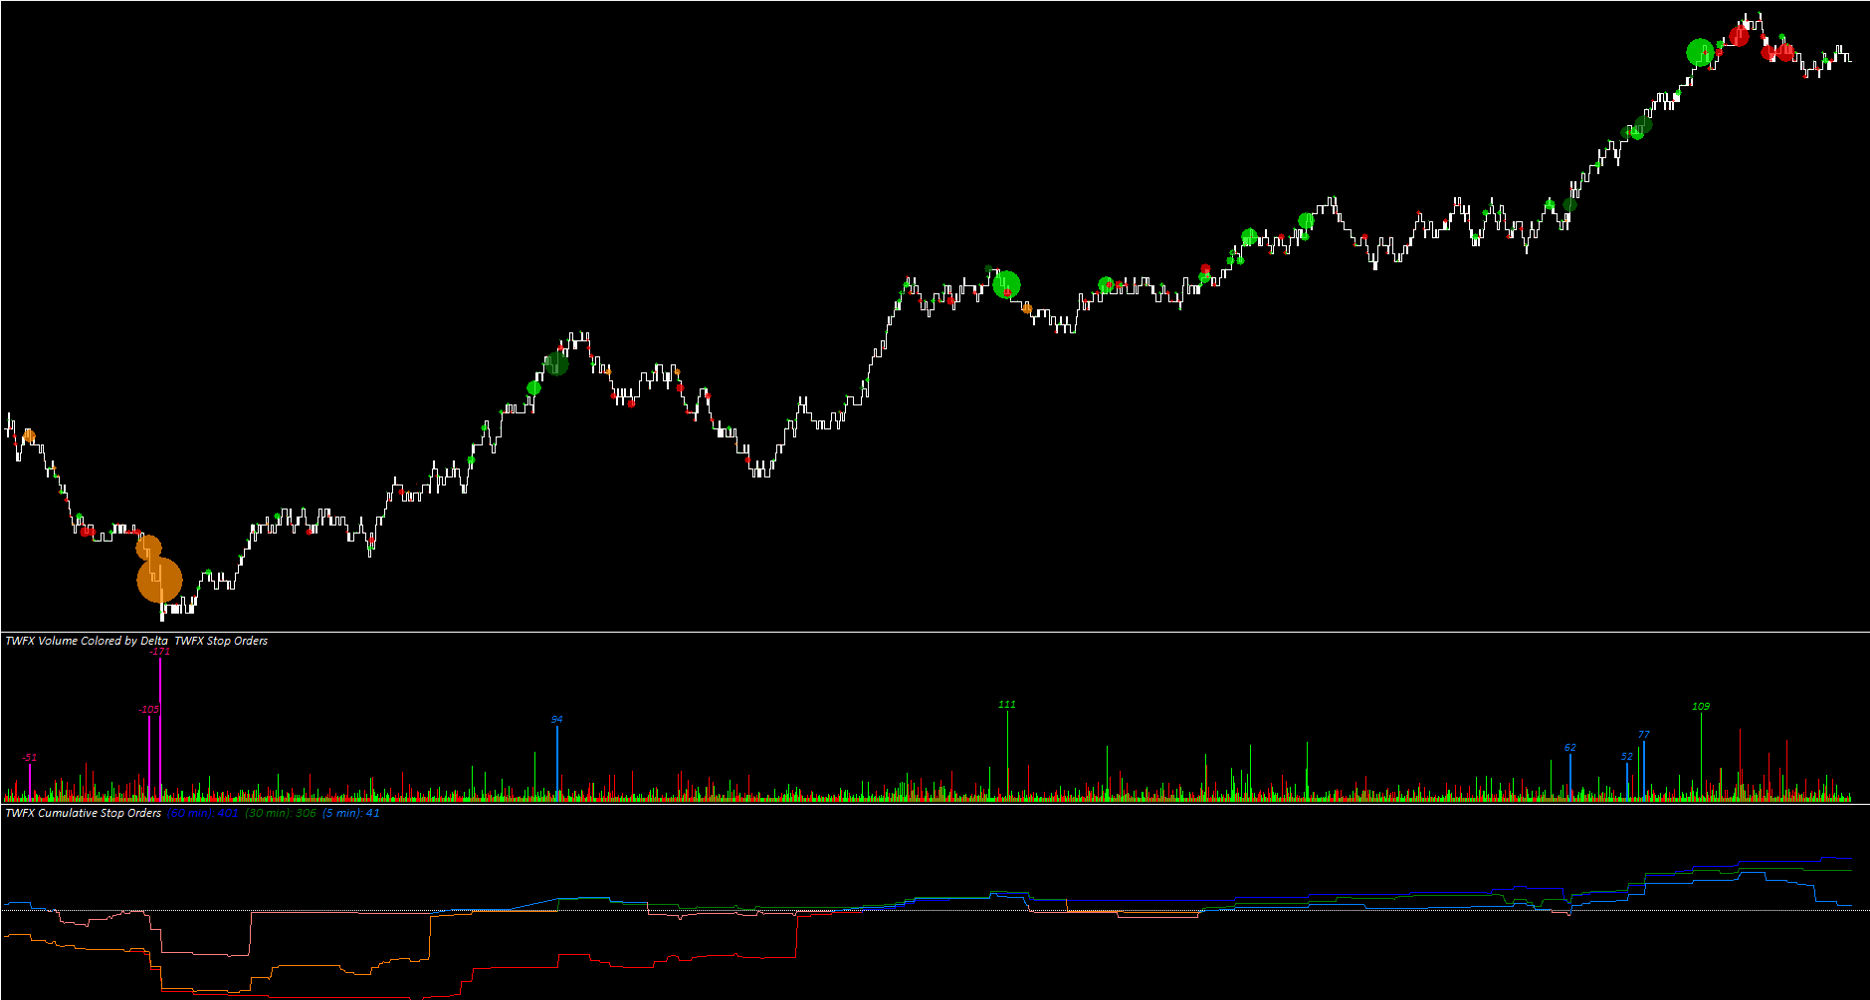
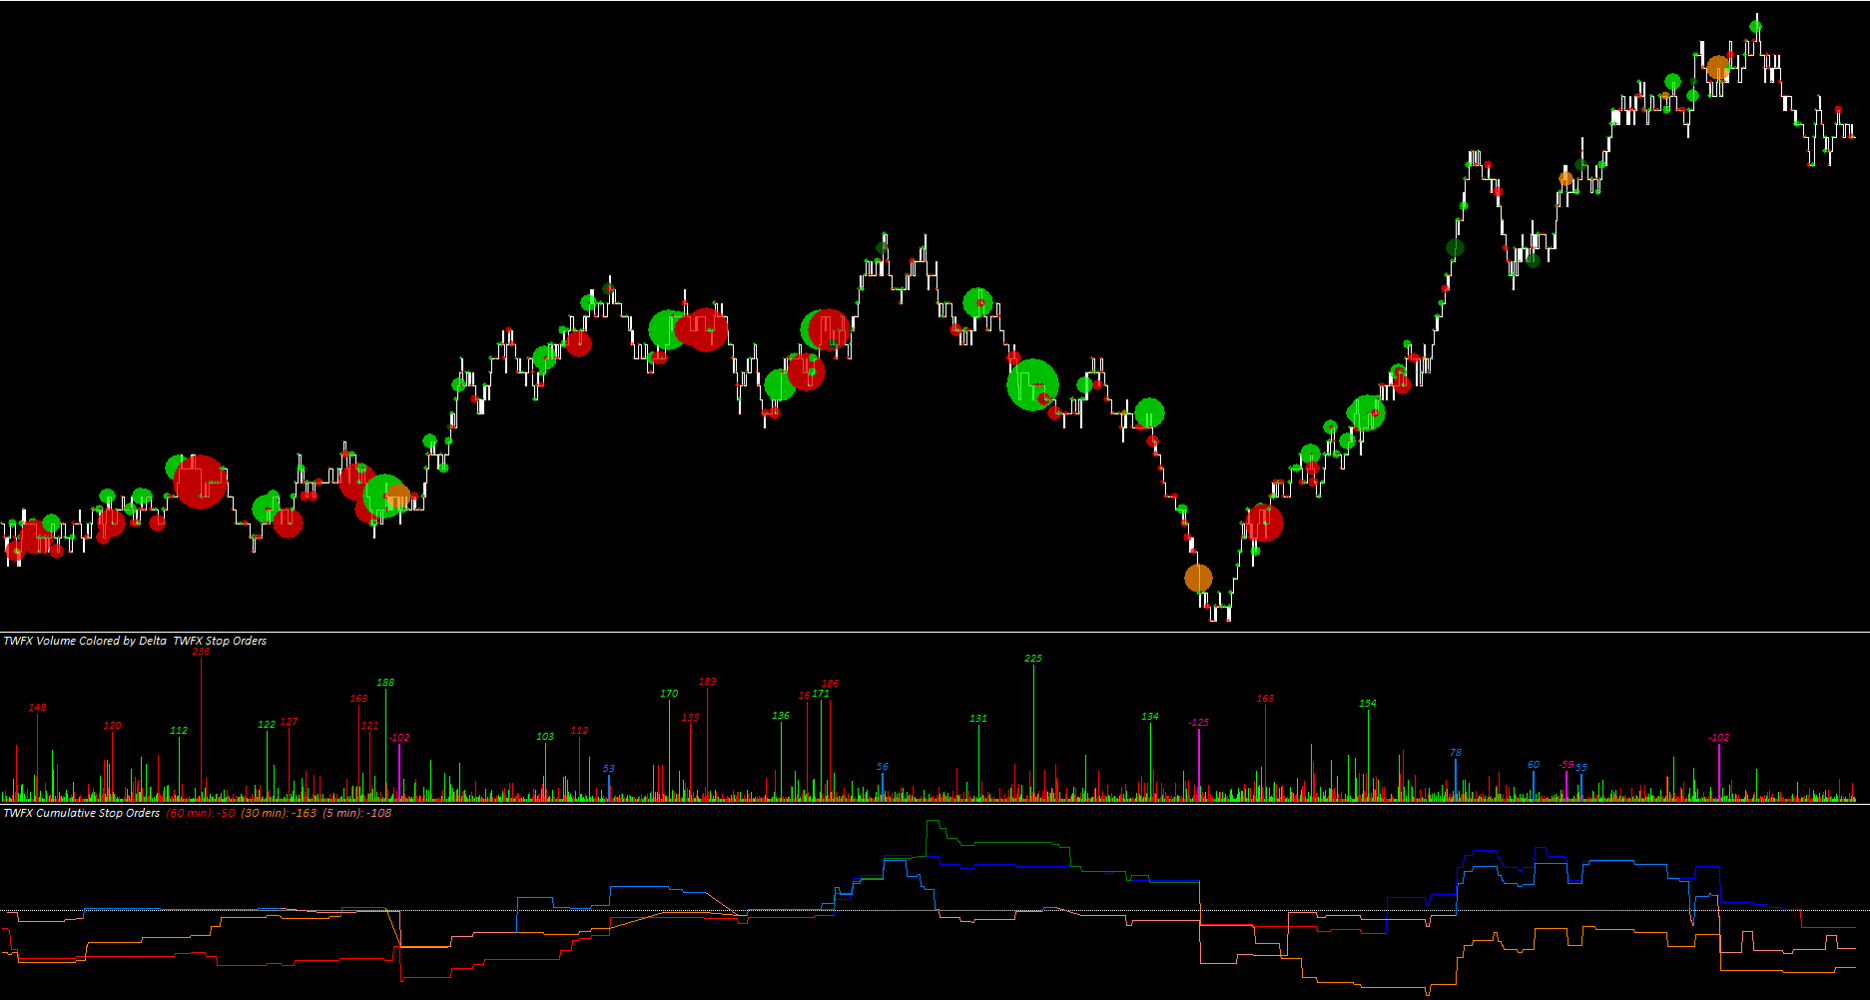
- TWFX Volume Colored by Delta
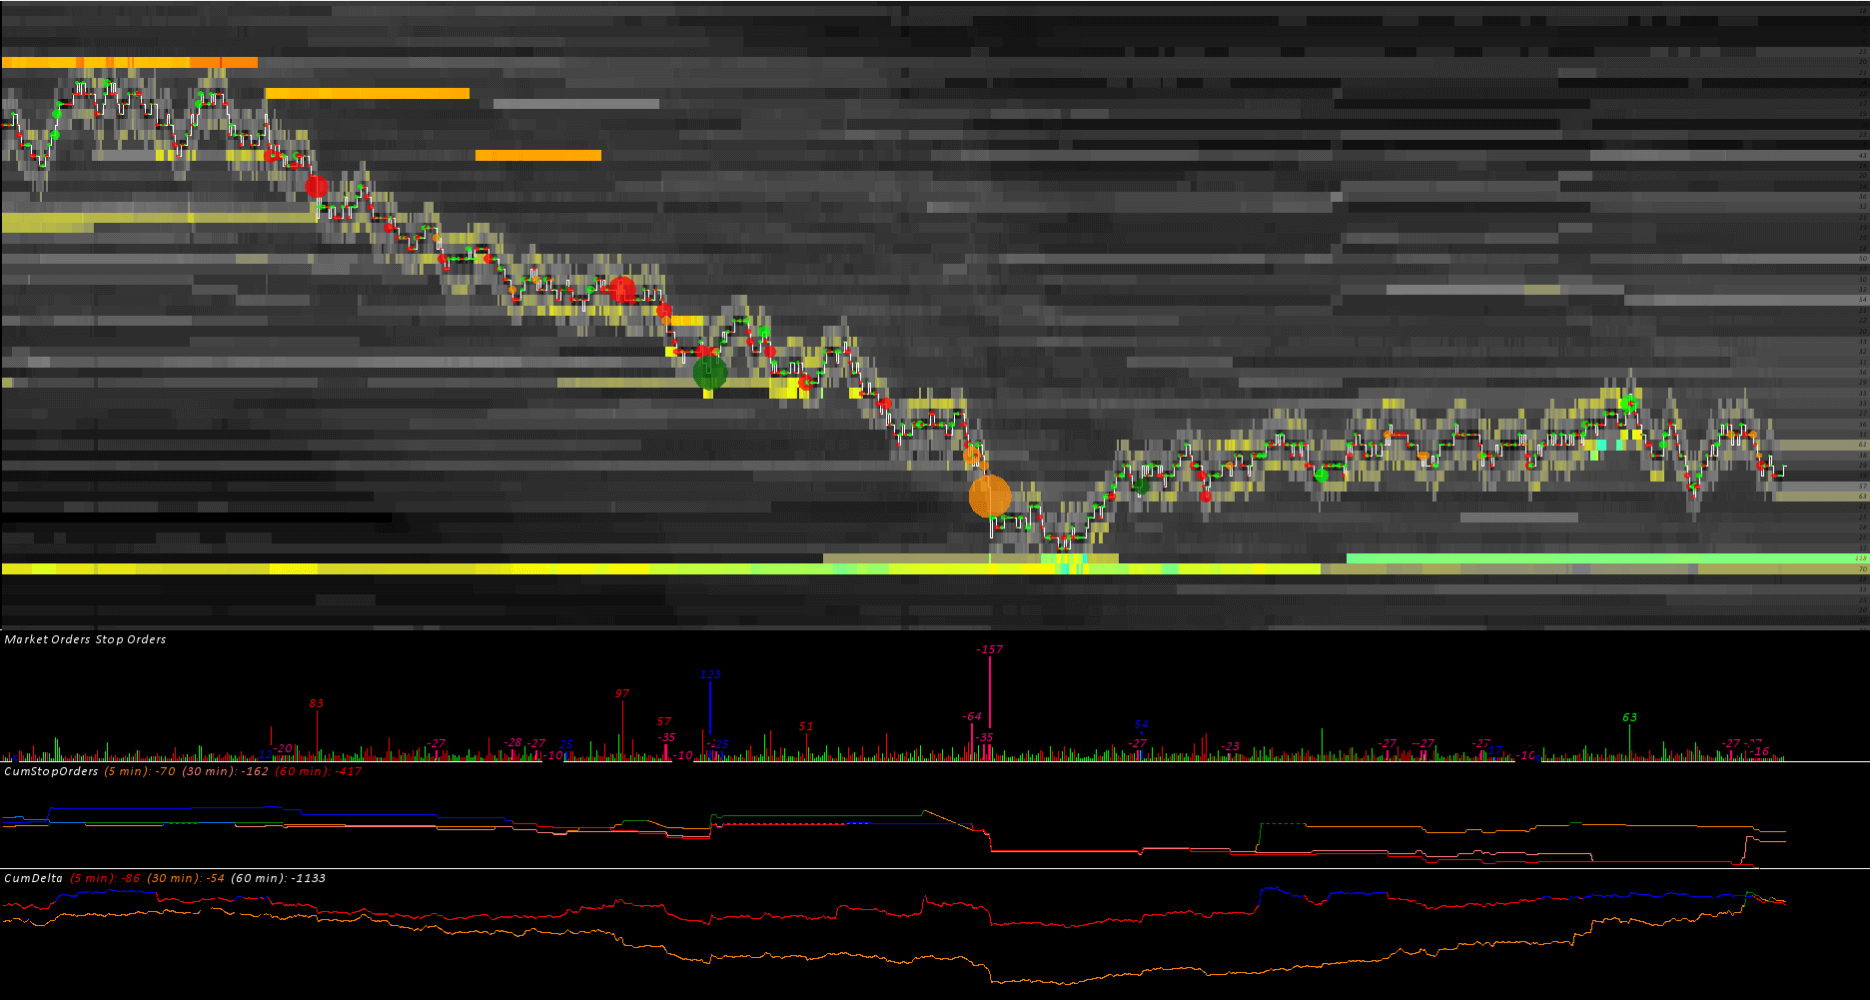
- TWFX Stop Orders
- TWFX Cumulative Stop Orders
- TWFX Cumulative Filtered Stop Orders
- TWFX Cumulative Market Orders
- TWFX Cumulative Filtered Market Orders
- TWFX Large Orders
- TWFX Cumulative Large Orders
More information can be found in the relevant blog update post Reconstructed Tape Chart, or in the relevant study documentation.
Features
Display a full custom chart representation of time and sales order flow, use the included support studies to provide additional visualisation options.
- Trade Tape Chart (Main):
- Plot raw order data – individual market/limit orders or exchange reported summary trade*.
- Plot aggregated order data – combine orders according to either: time & price; time & type; or market order (multiple prices). Aggregation time period adjustable between 1-1000ms.
- Apply volume filtering to remove trades above / below the maximum / minimum volume thresholds.
- Trade Tape Chart (Overlay):
- Visualize order size and location using trade dot display.
- Control the appearance of trade dots using the various draw style, scaling and coloring options available.
- Plot ask & bid price lines and optionally highlight trades that occur above (below) the best ask (bid) price.
- Display order size as text at price level.
- Volume Colored by Delta:
- Plot order volume histogram with optional text display.
- Color based on ask or bid trade.
- Highlight high volume orders using alternate colors.
- Stop Orders:
- Display orders identified as potential stops, with optional text display.
- Play alert when stop order(s) exceed specified size.
- Cumulative Stop Orders / Cumulative Filtered Stop Orders:
- Display accumulated size of potential stop orders.
- Various accumulation period and reset options.
- Filter based on minimum / maximum size.
- Cumulative Market Orders / Cumulative Filtered Market Orders:
- Display accumulated Ask and Bid order volume area graph, along with cumulative delta.
- Various accumulation period and reset options.
- Filter based on minimum / maximum size.
- Large Orders:
- Display large market orders, with optional text display.
- Play alert when large order exceeds specified size.
- Cumulative Large Orders:
- Display accumulated size of large market orders.
- Various accumulation period and reset options.
- Filter based on minimum size.
*applies to only CME group data and only when using Sierra Chart Denali Data Feed, see also Combine Trades into Original Summary Trade
Software Requirements
To use the TWFX Reconstructed Tape Chart Study, you will need a Sierra Chart Service Package 3 or Package 5* subscription.
Use of a good quality data feed, providing accurate tick-by-tick data is requirement, anything less may lead to inaccuracies and incorrect representations.
Although not actually a requirement, use of the Sierra Chart Denali Exchange Data Feed is highly recommeneded.
*Service Package 5 is required to access the Sierra Chart Market Depth Historical Graph as shown in the product images.
Release Notes
v1.0.0.0 – Initial Release – TWFX_RCTS_2151_64.dll requires Sierra Chart v2195 or later.
v1.0.1.2 – Updated for latest Sierra Chart – TWFX_RCTS_64.dll requires Sierra Chart v2566+ or 2897+ (separate files are provided).
Getting Started
- After purchasing, you will receive a license key via email (which you can also find in the ‘My Account’ section here)
- Activate your license key and assign it to your Sierra Chart account here
- After your license is activated and assigned, the software will automatically download next time you restart Sierra Chart (or you can download the software here)
- Restart Sierra Chart and start using the studies
- More general information can be found in the FAQs section
- For more information about these studies, refer to the relevant documentation
Purchasing Options
Free Trial
15-Days Free- Limited to one per customer
- Fully Featured
- Try before you buy
- Technical support available
Monthly
Subscription- Recurring payment
- Cancel any time
- Receive product updates
- Technical support available
Annual
12 Month License- Recurring payment
- >15% Saving vs. Monthly
- Receive product updates
- Technical support available
Lifetime
No Expiry License- One time payment
- Best value option
- 12-months product updates
- 12-months technical support
2 reviews for TWFX Reconstructed Tape Chart
You must be logged in to post a review.
Dennis Jahn (verified owner) –
Very good, useful and well done study.
For Orderflow Trading in Sierra Chart this is a must have. Also, really nice developer that helps with problems and requests.
M Patel (verified owner) –
Great product.
Allows you to see reconstructed tape on the chart without having to constantly keep an eye on the tape. This allows the tape to be use din conjunciton with other order flow information on the chart ie. absorbtion, effort no result etc.
I watched the below Youtube video (from someone who is unrelated to the seller) and this product allowed me to set-up the recon. tape as described in this video except that it plots on a chart instead of the tape. It has really helped with visualization.
https://www.youtube.com/watch?v=e3AP2QtR5c8
I monitored the recond Trade Chart in relation to the tape and the numbers all agreed.
Greta product – highly recommended for those who find the tape “too fast” and like to see that tape on the chart.