
Market Depth
Monitor pulling & stacking of limit orders across 15 price levels
Charting
Choose from a selection of chart display options
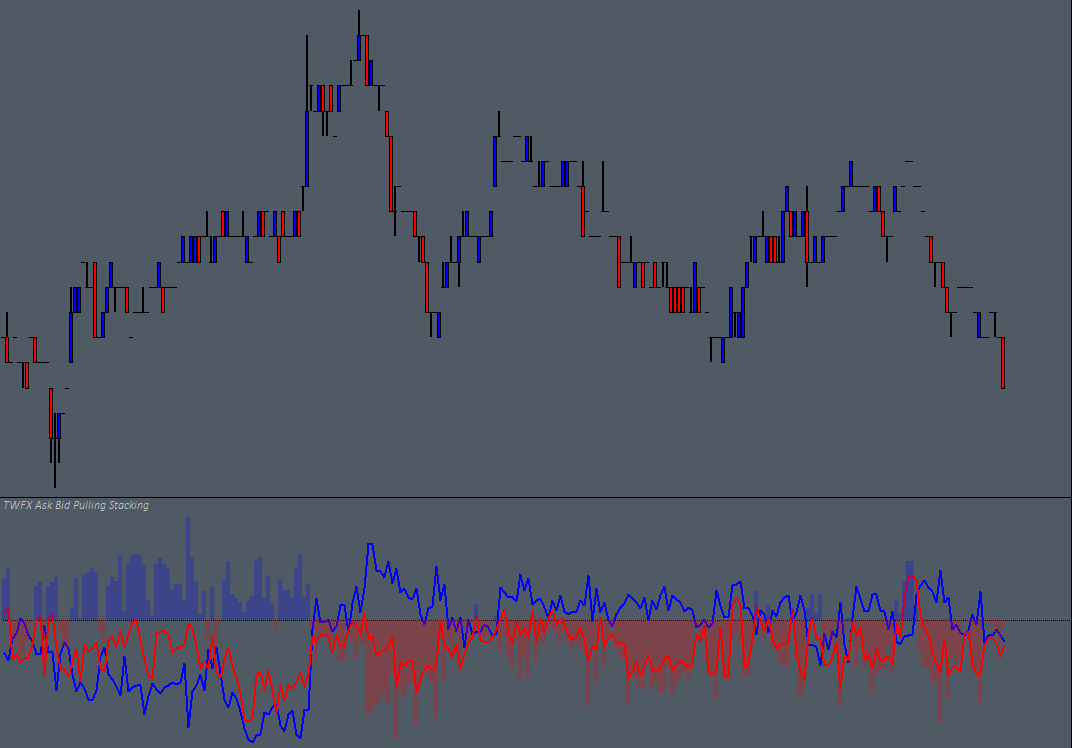
Imbalance
Visualise imbalances between ask & bid limit order pulling & stacking
Time Frame
Asynchronous display time frame option down to 1 second resolution
Trade Ideas
Additional market generated information to help qualify trade ideas
Management
Another tool to help with trade management / exits
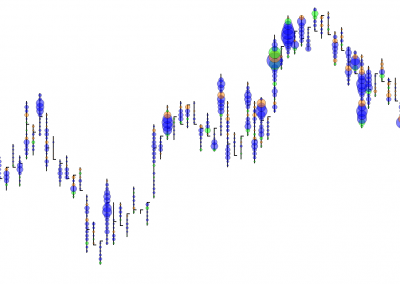
The Basics
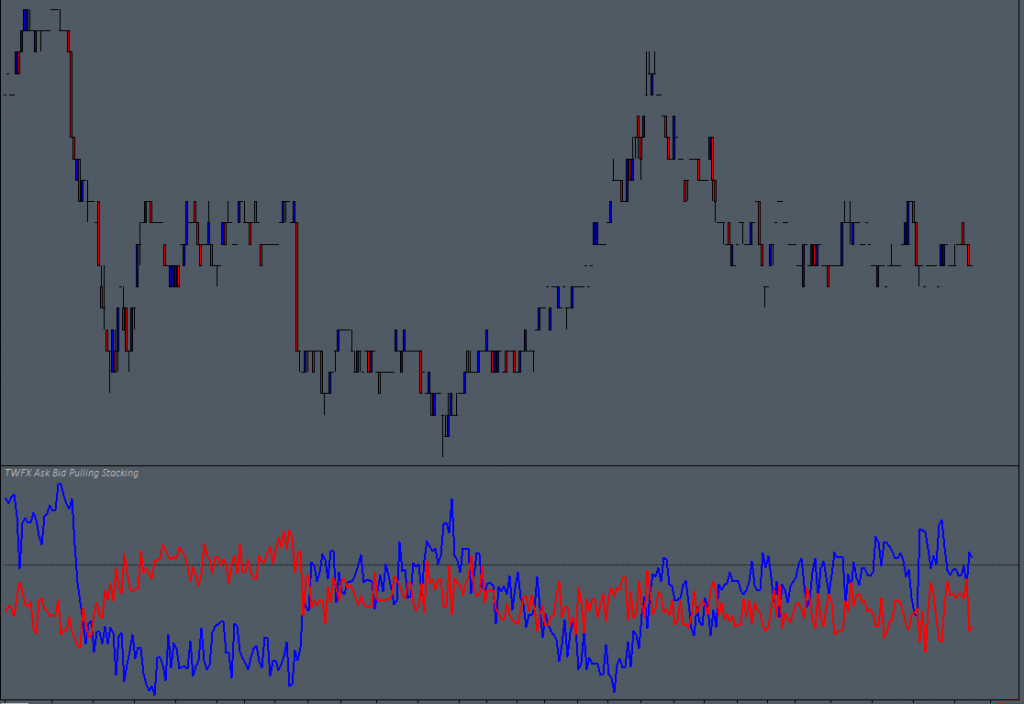
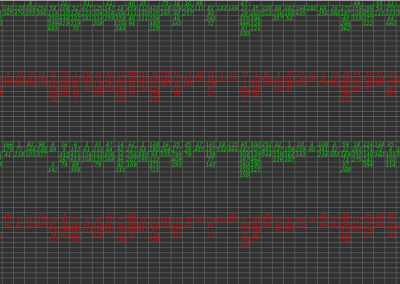
The Ask Bid Pulling Stacking study monitors the market liquidity / available orders over first 15 Ask and Bid price levels in the DOM, it can be used to monitor / gauge the behaviour of limit (passive) buyers / sellers nearest to current price.
If liquidity (in the form of limit orders) is removed (pulled) from the order book, then fewer market (aggressive) orders will be required to move price a given distance, conversely if liquidity is added (stacked) to the order book, then more market orders will be required to move price a given distance.
monitors the market liquidity / available orders…
Possible Uses
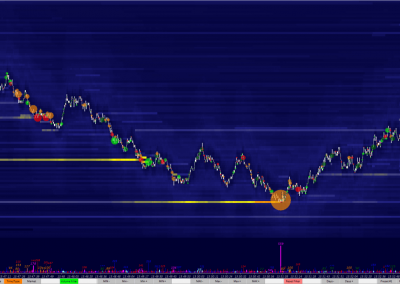
A simple use case could be to evaluate the behaviour of limit order participants prior to entering a trade, or even when managing a trade.
If price is moving in a direction and liquidity is pulled in front of price as it moves (and possible even stacked behind), this can be an indication that the market may continue to move in the prevailing direction over the very near term.
If liquidity is stacked in front of price as it moves (and possibly pulled behind), this can be an indication that the current move may be reaching the end – possibly a good time to exit a trade.
evaluate the behaviour of limit order participants prior to entering a trade…
A little bit more about the study
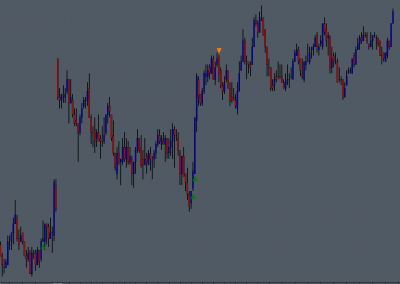
The Ask Bid Pulling and Stacking data is recorded each time that the chart is updated (chart update interval), this makes it possible to display the data synchronized to the underlying chart bar period, or in asynchronous mode, with a minimum duration of 1 second.
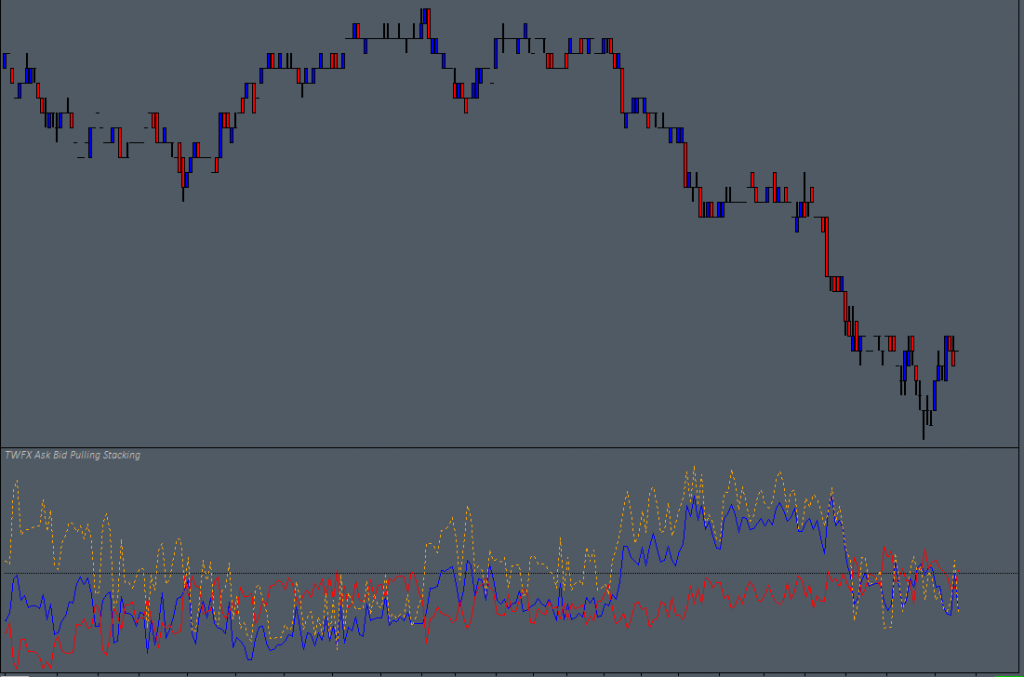
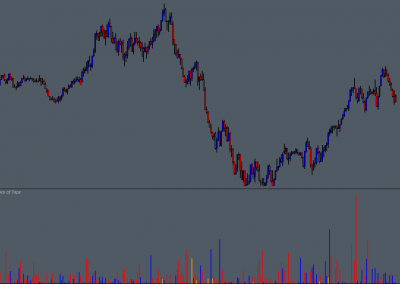
The study data is output via 3 subgraphs, enabling a selection of different display possibilities. The combined Ask Bid Pulling Stacking subgraph can be configured to display Ask Bid Difference Absolute, Ask-Bid, or Bid-Ask.
a selection of different display possibilities…
*Update – June 2021: Free Studies Collection 1.3.0.0
The Ask Bid Pulling and Stacking study has been reconfigured so that number of depth levels recorded and displayed is user configurable. It is now possible to select from 1 to 15 depth levels per side, rather than a fixed value of 10.
0 Comments