
Orderflow
Monitor volume at price data for specific orderflow events at bar edges
Volume
Expose volume at price data to subgraphs enabling additional analysis
Alerts
Use the study subgraph data as the basis for buidling orderflow based alerts
Trade Ideas
Market generated information to help qualify trade ideas
Management
Another tool to help with trade management / exits
The Basics
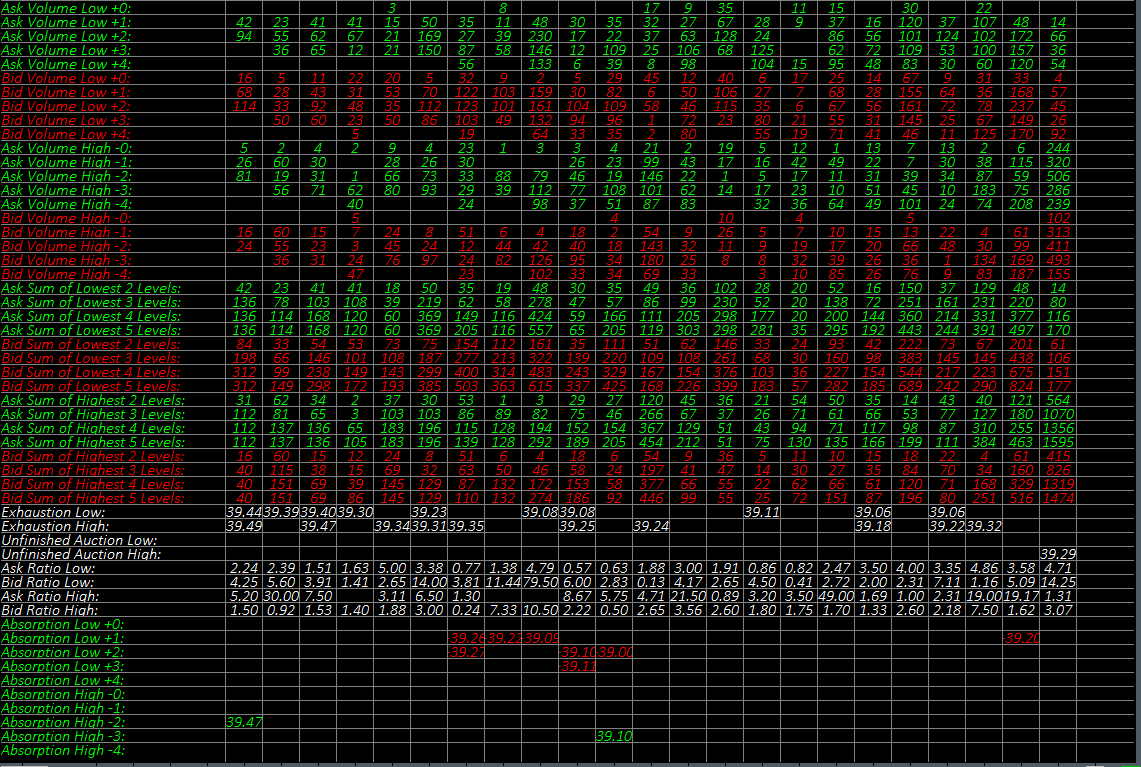
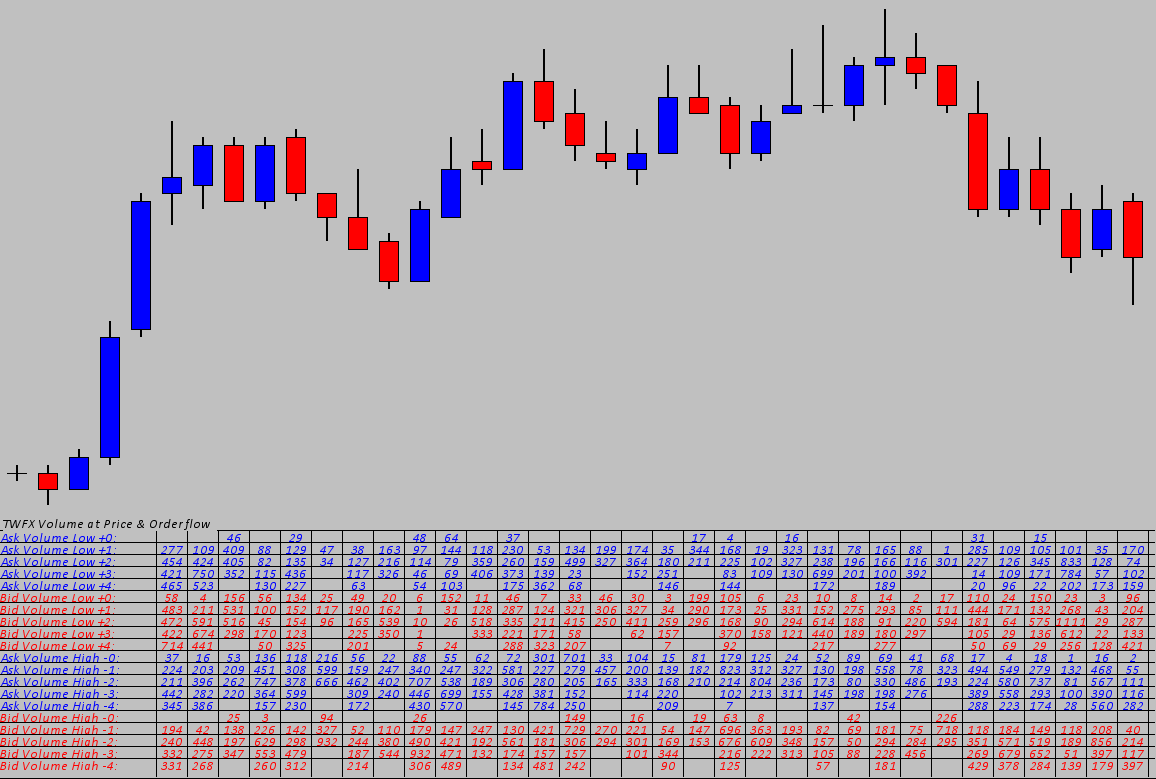
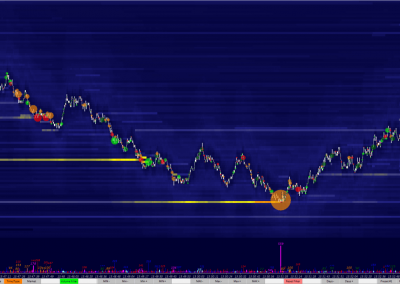
The Volume at Price and Orderflow study monitors and records the traded volume at the lowest and highest price levels (upto 5) for each chart bar.
The recorded data is output via subgraphs, enabling both the creation of alerts based on volume at price data, and additional analysis of volume at price data.
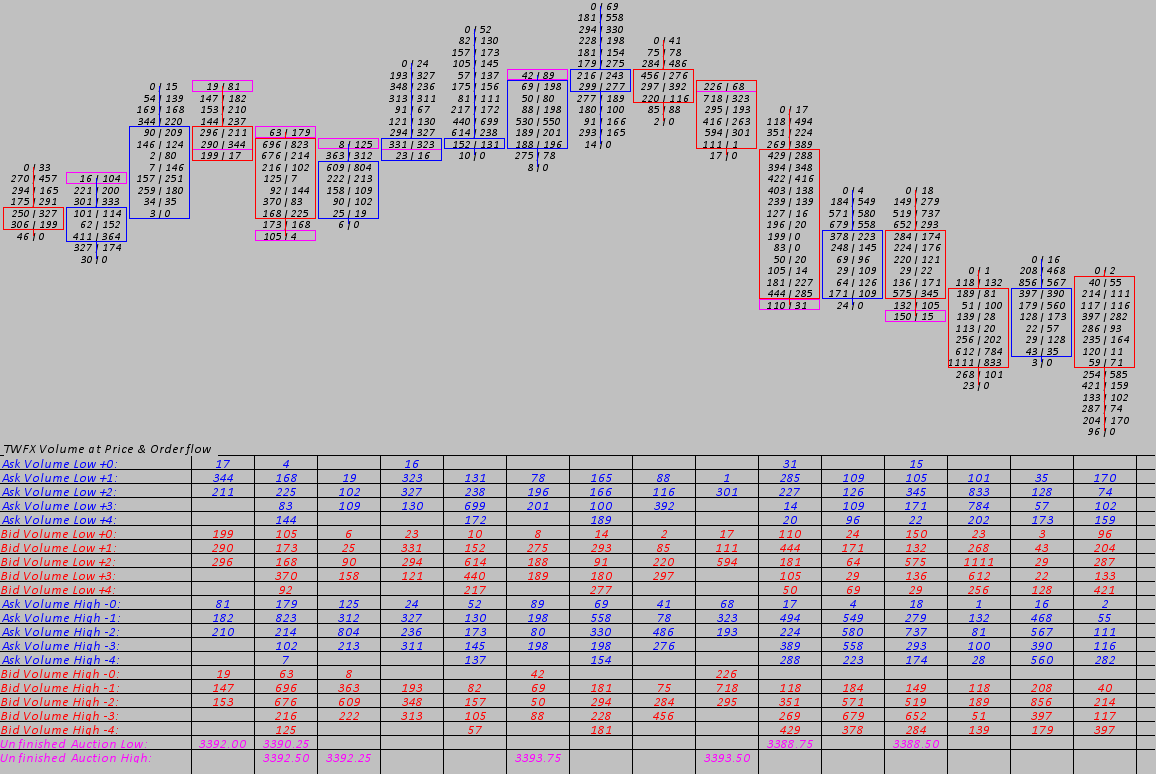
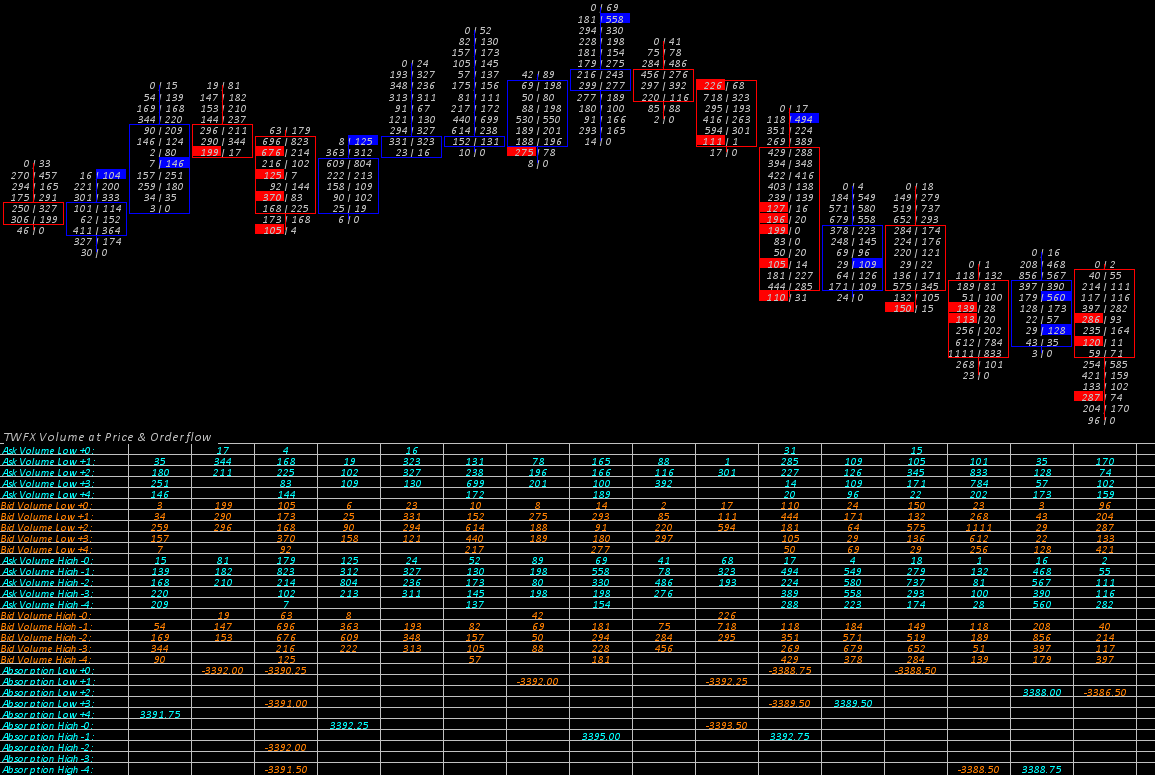
Simple orderflow analysis can be performed using the study to look for conditions such as absorption, exhaustion, and unfinished auctions.
Output subgraph data can be displayed in numeric table format, in place of, or in addition to the main price graph.
Simple orderflow analysis can be performed using the study…
Possible Uses
Some examples of how the study might be used in conjunction with other methods or techniques, to aid the decision making process regarding trade entry, exit, or management:
- Monitor for exhaustion conditions as price tests beyond structural levels (e.g. prior day high/low, edge of price range, edge of current value area) and use this as one of the criteria for potentially initiating a reversal trade.
- Monitor for unfinished auctions as price approaches structural levels, and then use the presence of this orderflow condition to help define potential continuation trades or targets.
aid the decision making process…
A little bit more about the study
The Volume at Price and Orderflow study utilises upto 55 subgraphs to provide simple access to volume at price data as seen when using the numbers bars study.
A selection of options are provided allowing the study to be used in a number of different ways, from data access to simple orderflow evaluation. The parameters used during orderflow evaluation are configurable and can easily be adjusted to suit different instruments or chart time periods.
When used in conjunction with the built in Sierra Chart alert studies (e.g. Color Bar Based on Alert Condition), a wide array of alerts can easily be configured to suit different orderflow conditions.

0 Comments