
Orderflow
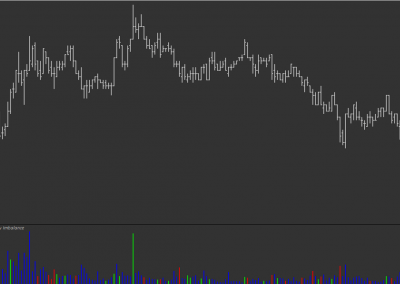
Monitor location of highest volume for each chart bar
Support & Resistance
Identify potential areas of short term support or resistance
Absorption
Identify potential locations of absorption
The Basics
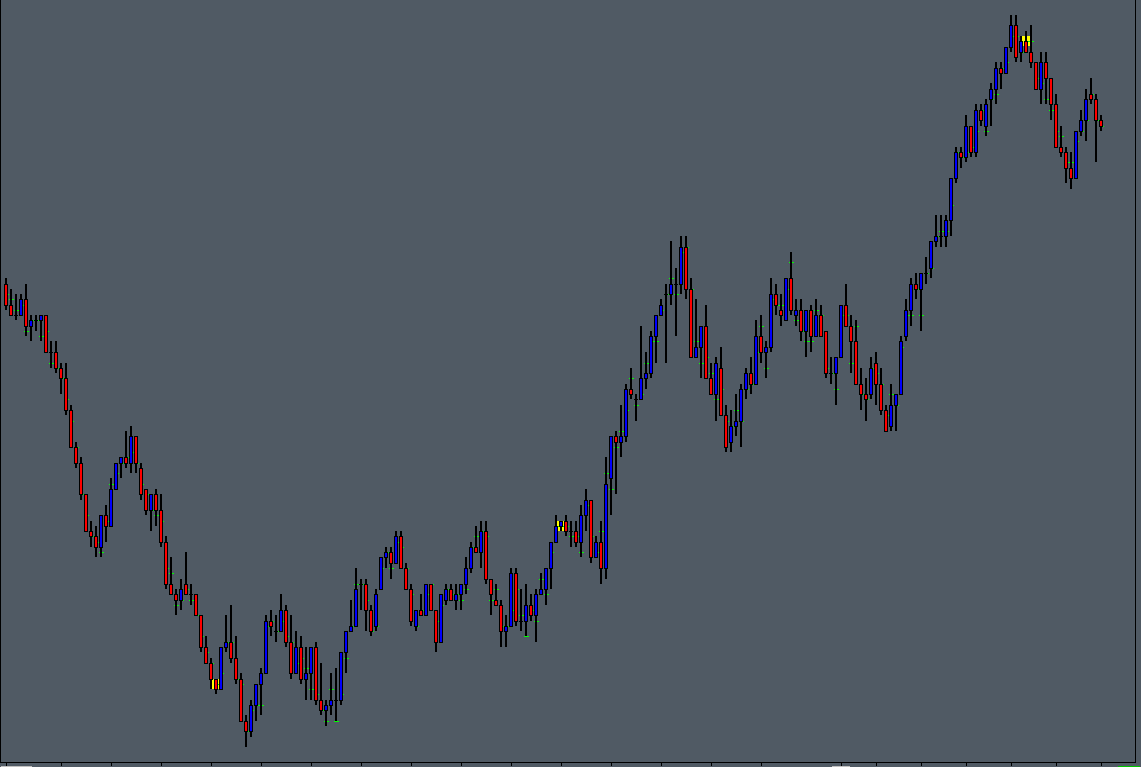
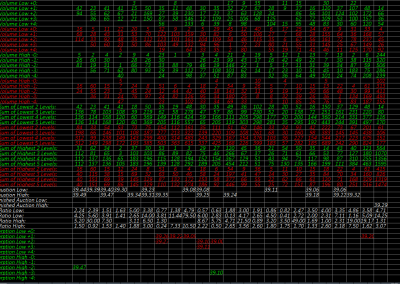
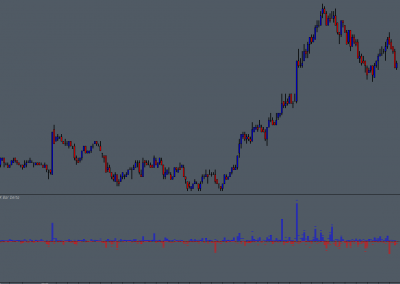
The POC (Point of Control) per Bar Study monitors traded volume at price data and calculates the Volume Point of Control for each chart bar. An option is provided to highlight the POC in each chart bar, and/or to highlight the POC when a specified volume threshold is met or exceeded.
calculates the Volume Point of Control for each chart bar…
Possible Uses
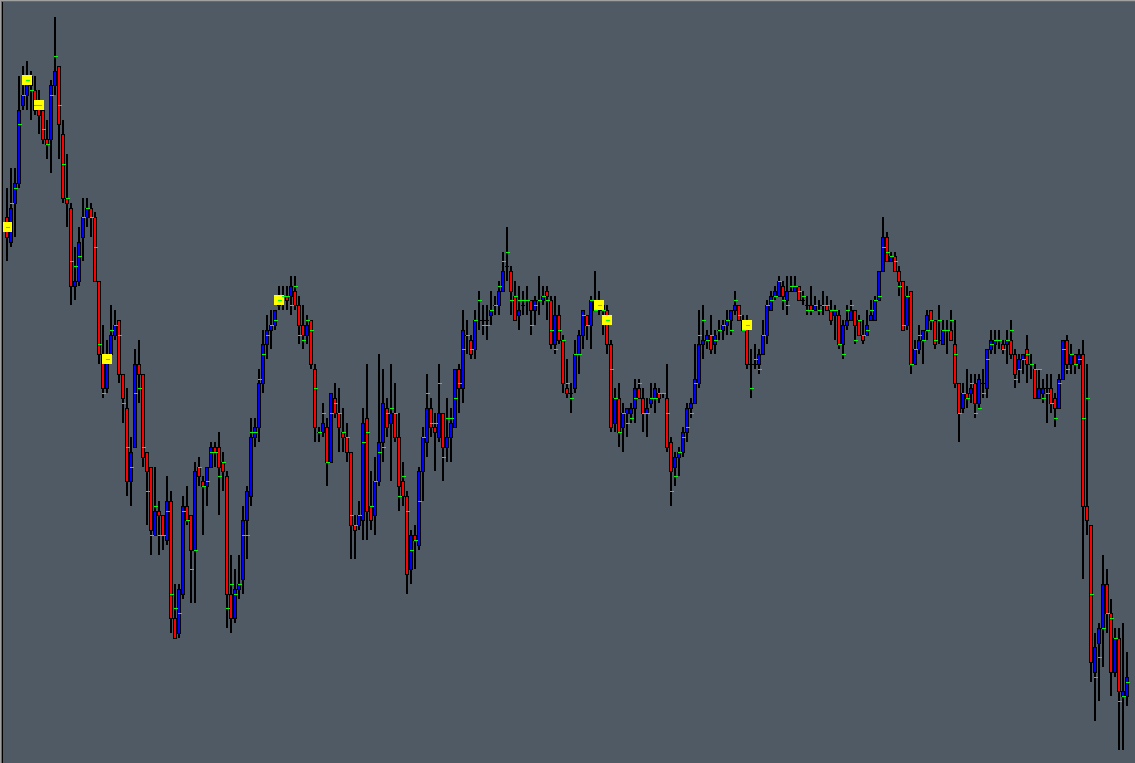
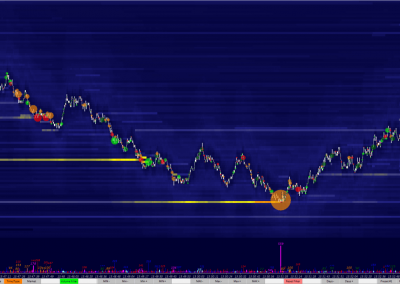
A simple use case could be to observe areas of concentrated activity (potential absorption), using the ‘High Volume POC Highlight’ feature, and, in conjunction with other methods or techniques, look for trade entries (or exits) around the identified areas, as they can potentially act as support or resistance in the short term.
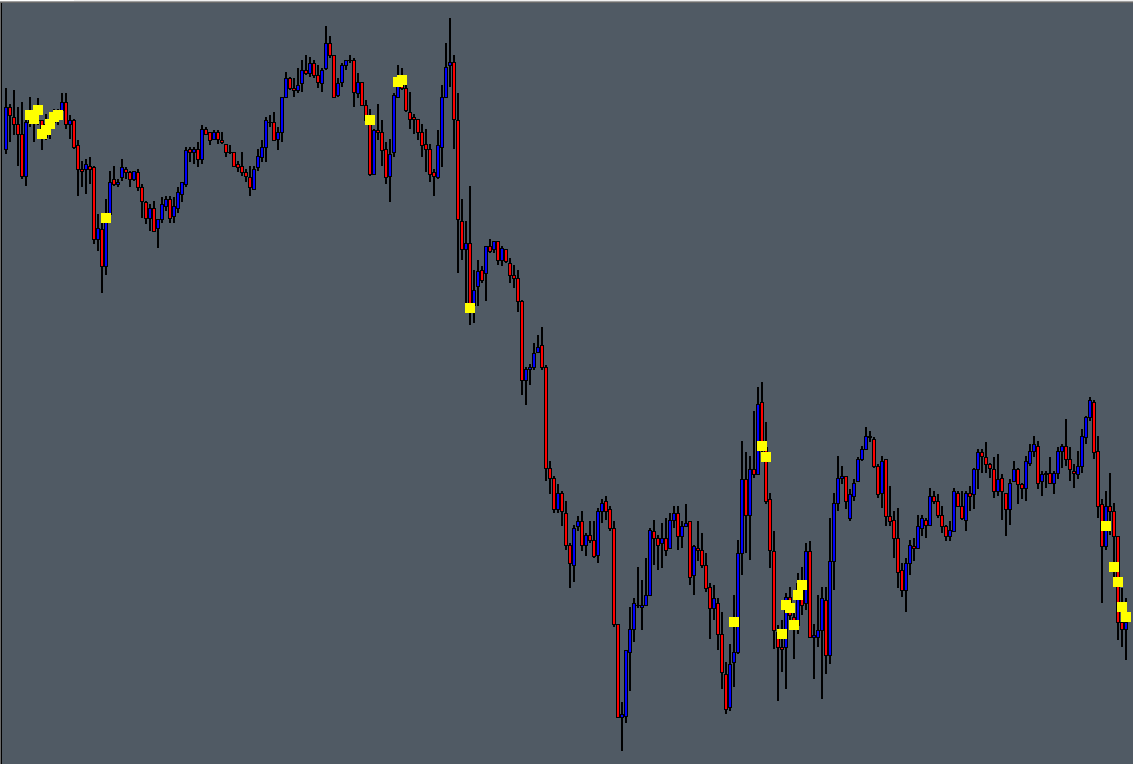
In addition to the above, the ‘Highlight All POCs’ feature may also be useful in helping to determine potential locations for retracement type order entries (the initial entry decision having been determined through other means), as similarly the POC can potentially act as support or resistance in the short term.
the POC can potentially act as support or resistance…
A little bit more about the study
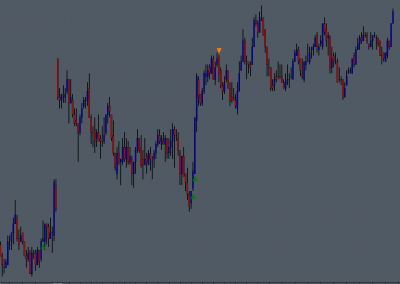
The study data is output via 2 subgraphs, enabling a highlighting of the point of control for each chart bar and/or high volume points of control.
0 Comments