
Charting
Choose from a selection of chart display options
Time Frame
Optional asynchronous mode with 1 second resolution
Speed
See which side of market is trading with more urgency
Trade Ideas
Additional market generated information to help qualify trade ideas
Management
Another tool to help with trade management / exits
The Basics
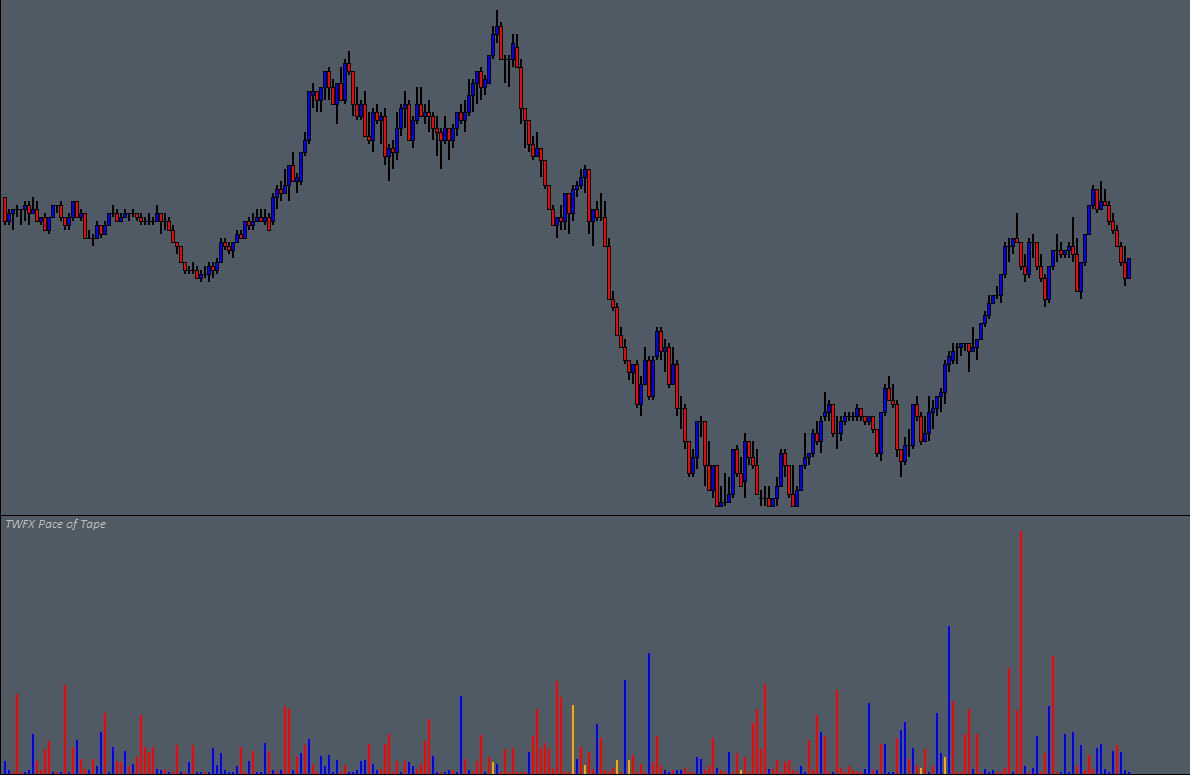
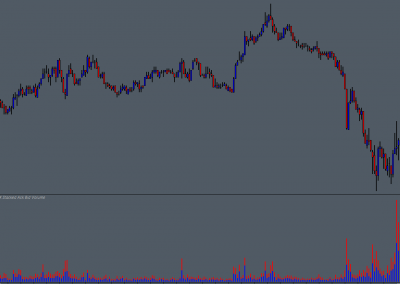
The Pace of Tape study tracks the rate at which orders are being filled and can be used to identify when trading is being conducted with greater urgency.
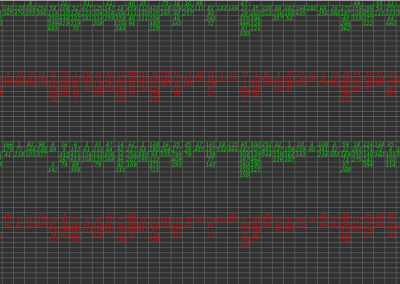
Depending on the display mode selected, the Pace of Tape study can also be used to see which side of the market is trading with the greatest urgency, or to see the relative urgency of trades at the Ask price vs. trades at the Bid price.
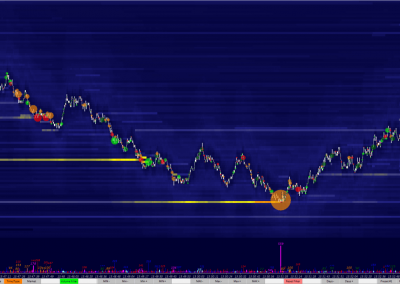
Sudden increases in trading activity can be seen and responded to quickly, whether that is waiting for order entry criteria to be met or to help with trade management.
see which side of the market is trading with the greatest urgency…
Possible Uses
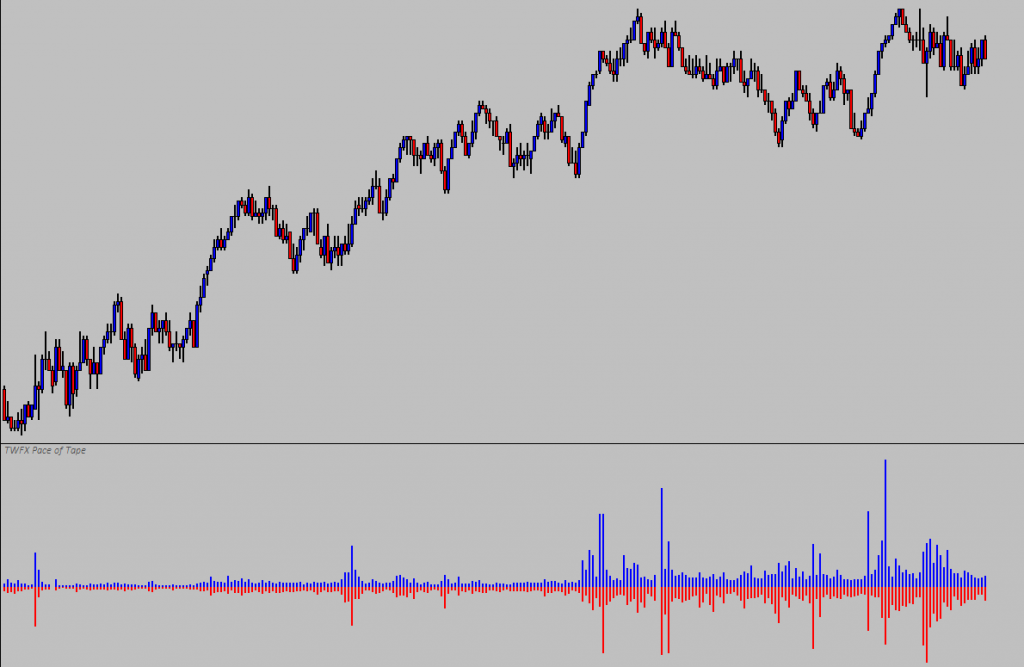
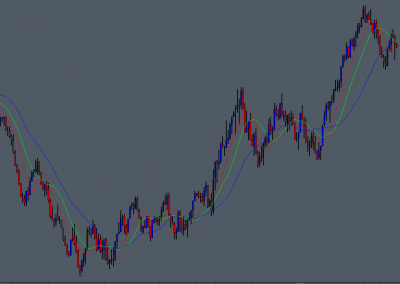
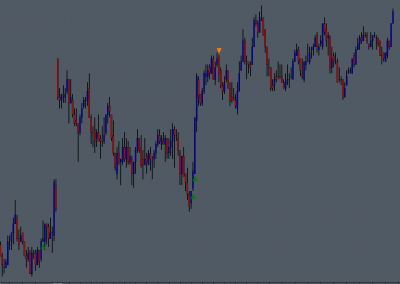
A possible use for the Pace of Tape study could be to combine with other methods / studies to help time trade entries or exits, or even to form part of the trade entry criteria.
If price is moving downwards towards an area that has been identified through other means as a potential buying location, then an appropriate increase in buying urgency, as shown by the Pace of Tape study, could form part of the trade qualification / entry criteria.
could form part of the trade qualification / entry criteria…
A little bit more about the study
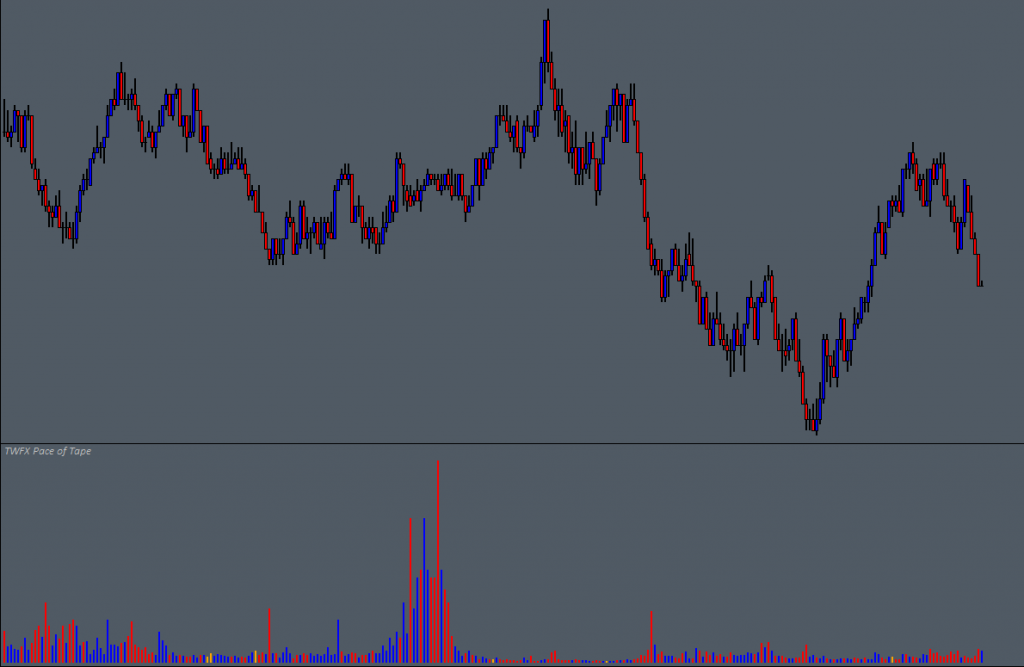
The Pace of Tape study has two modes of operation, synchronized to the underlying chart bar period, or asynchronous mode, where the bar duration is 1 second and independent of the underlying chart. When using asynchronous mode, the study output is volume per second, whereas when synchronized, the output is the calculated average volume per second.
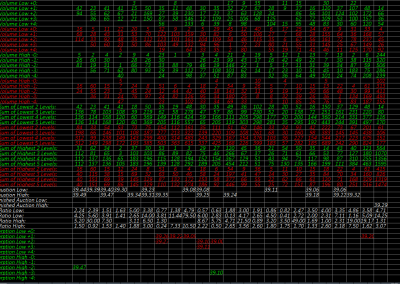
The study data is output via 3 subgraphs, enabling a selection of different display possibilities, currently including: Ask, Bid & Total Volume; Ask & Bid Volume; Total Volume; or Highest of Ask or Bid.
a selection of different display possibilities…

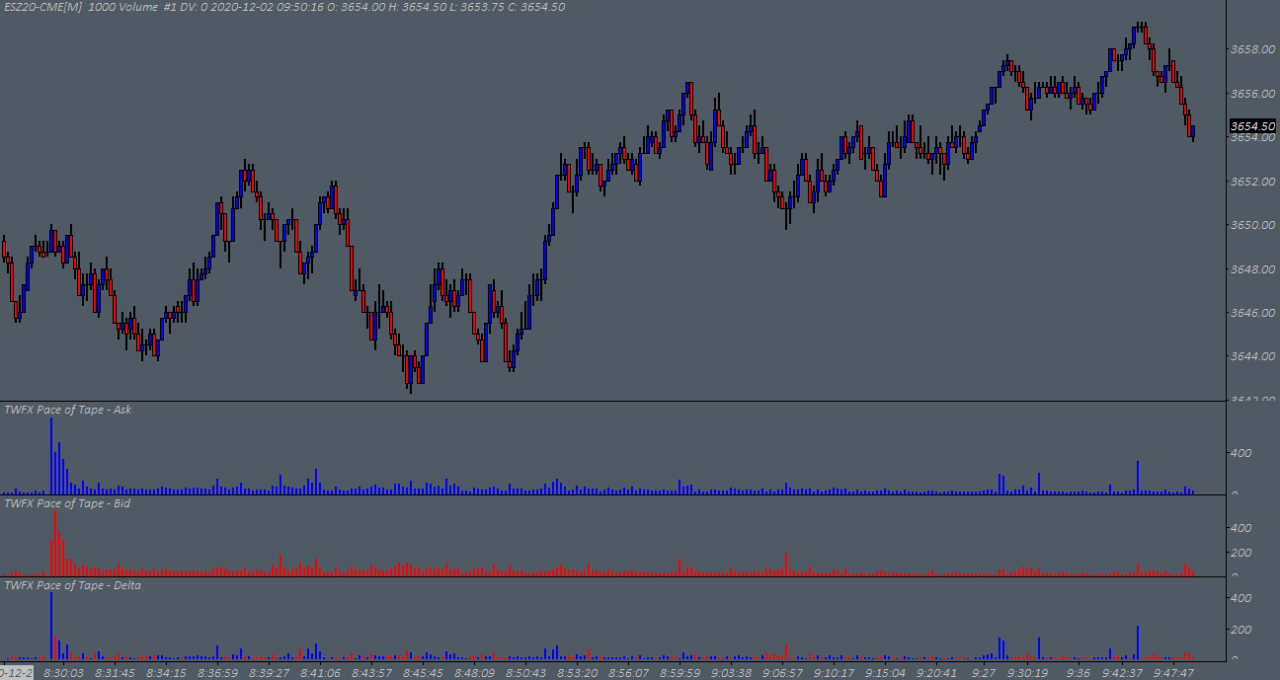
Update
Additionally, there are also 3 further display modes available: Ask; Bid; and Delta, showing the ask volume pace, bid volume pace and difference (Delta) between ask volume pace and bid volume pace respectively.
0 Comments