Charting
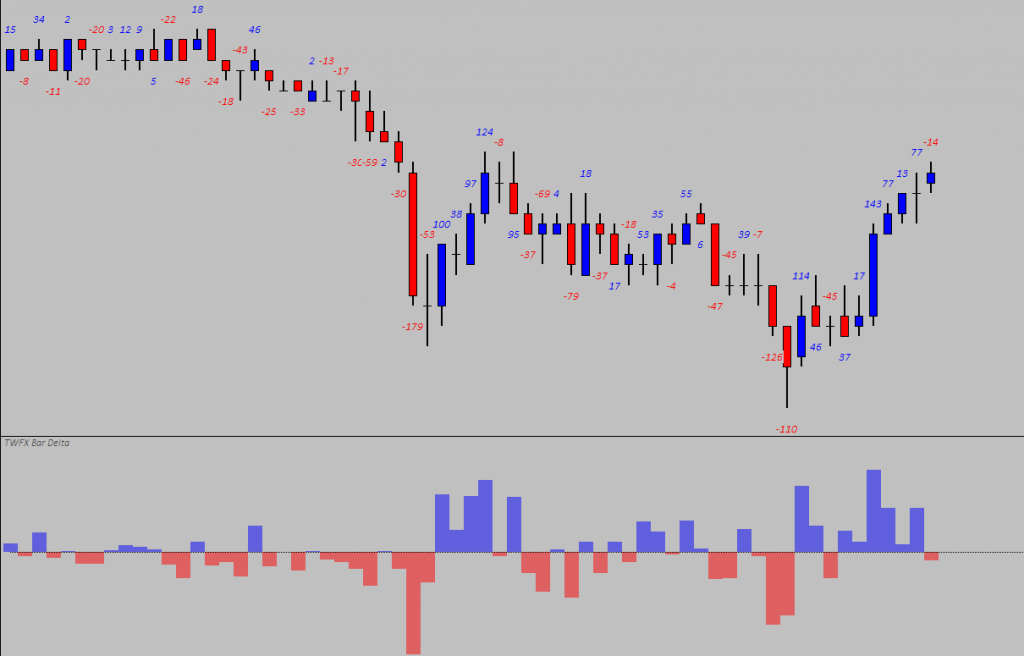
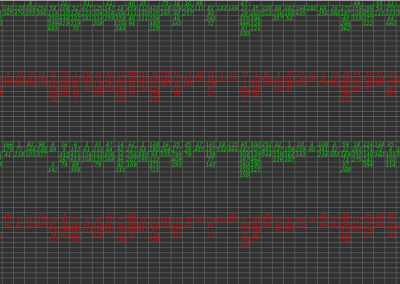
Choose from a selection of chart display options, including text
Imbalance
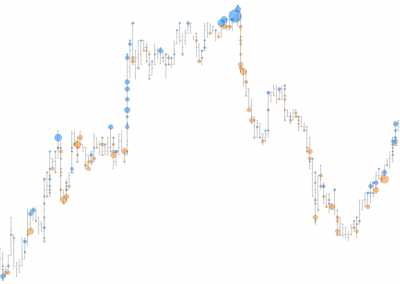
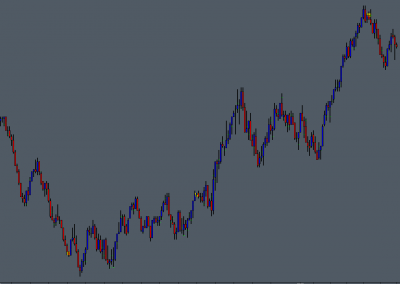
Visualise imbalances aggressive buyers & sellers
Alert
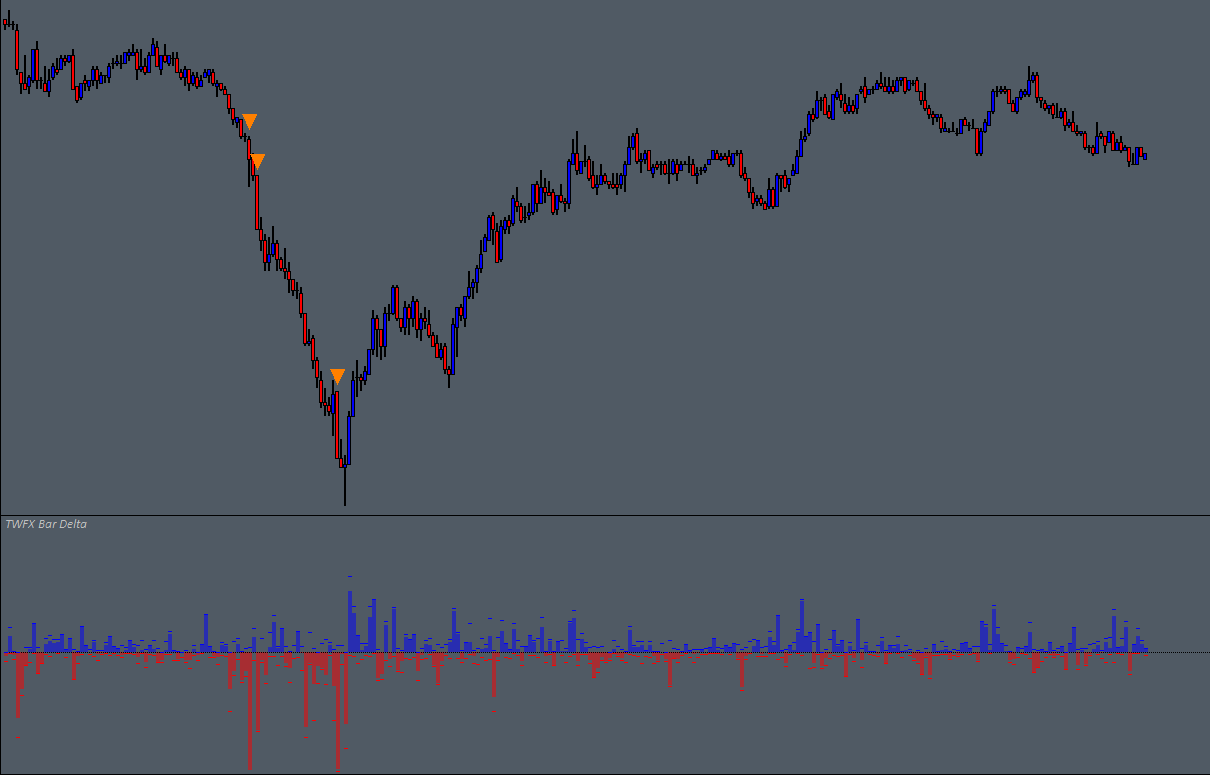
Built in alert function for extreme delta condition
The Basics
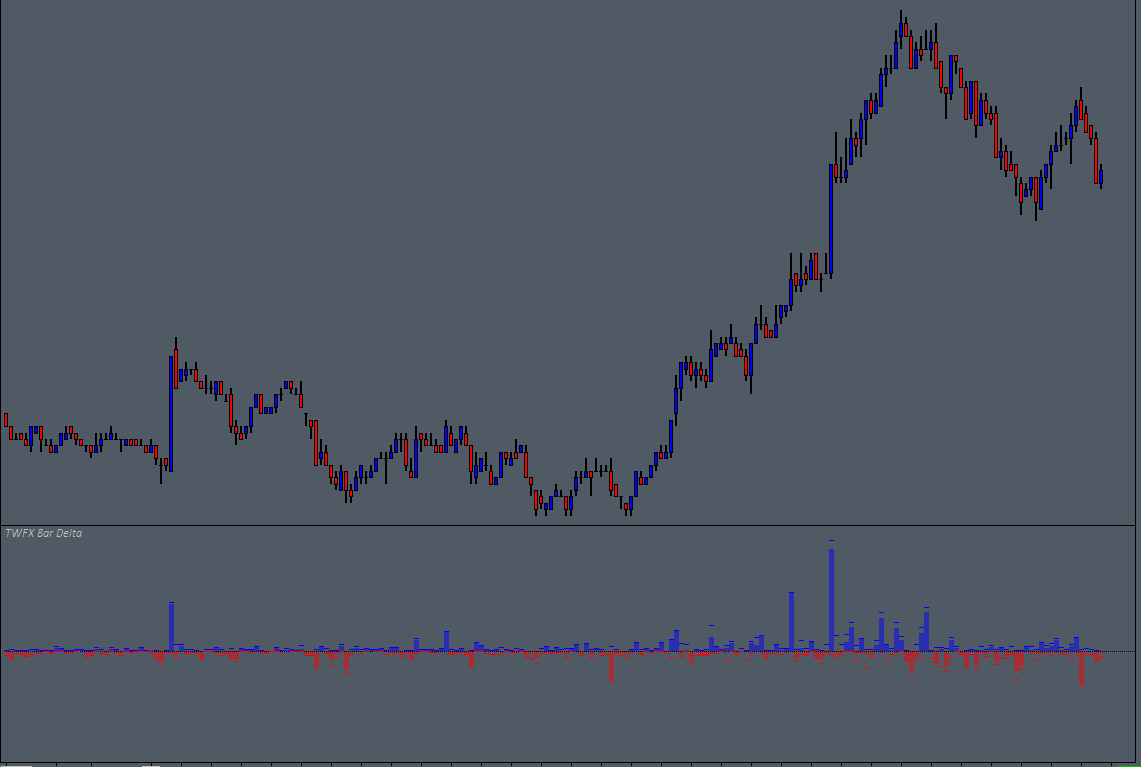
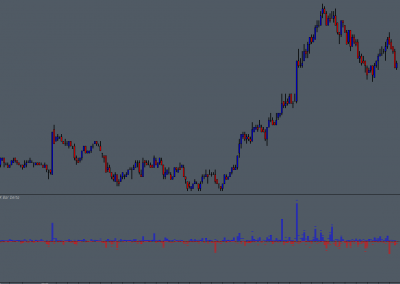
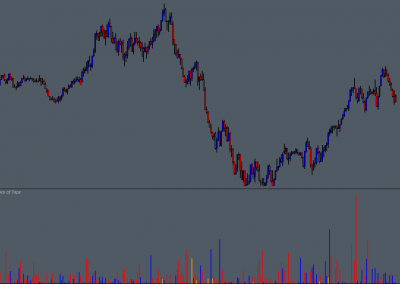
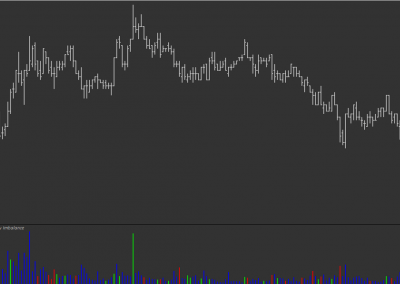
The Bar Delta study tracks the difference between Ask and Bid traded volume per chart bar period, it can be used to monitor the relative strength of aggressive (market) buyers and sellers.
In addition to the closing delta for each chart bar period, the minimum and maximum delta values are also recorded, and optionally displayed, giving a fuller picture of the behaviour of buyers and sellers.
monitor the relative strength of aggressive buyers and sellers…
Possible Uses
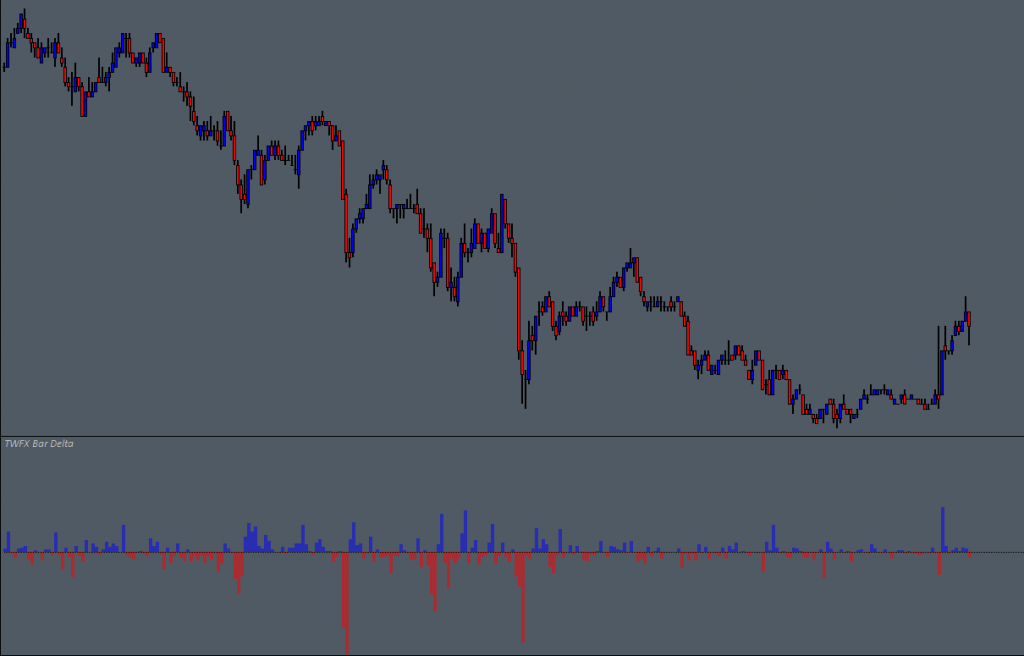
A simple use case could be to monitor for divergence between delta and price, as price approaches and/or tests beyond structural levels such as prior day high & low, or initial balance range high & low.
If price is moving in a direction, but delta is seen to be decreasing in magnitude, this can be a sign that the current move is reaching the end, as either there are fewer aggressive participants trading in the prevailing direction or price has reached a level that is more attractive to the opposing aggressive participants – possibly a good time to exit a trade or reduce risk.
monitor for divergence between delta and price…
A little bit more about the study
The Bar Delta study can be configured to plot a chart using the preferred draw style(s), showing Delta, and optionally Min-Delta and Max-Delta, or alternatively can be configured to display a text value above or below the main chart price bars.
The study also provides a configurable extreme delta alert function, using a minimum delta threshold and a closing delta as a percentage of maximum delta threshold.
configurable extreme delta alert function…

0 Comments