
The Basics
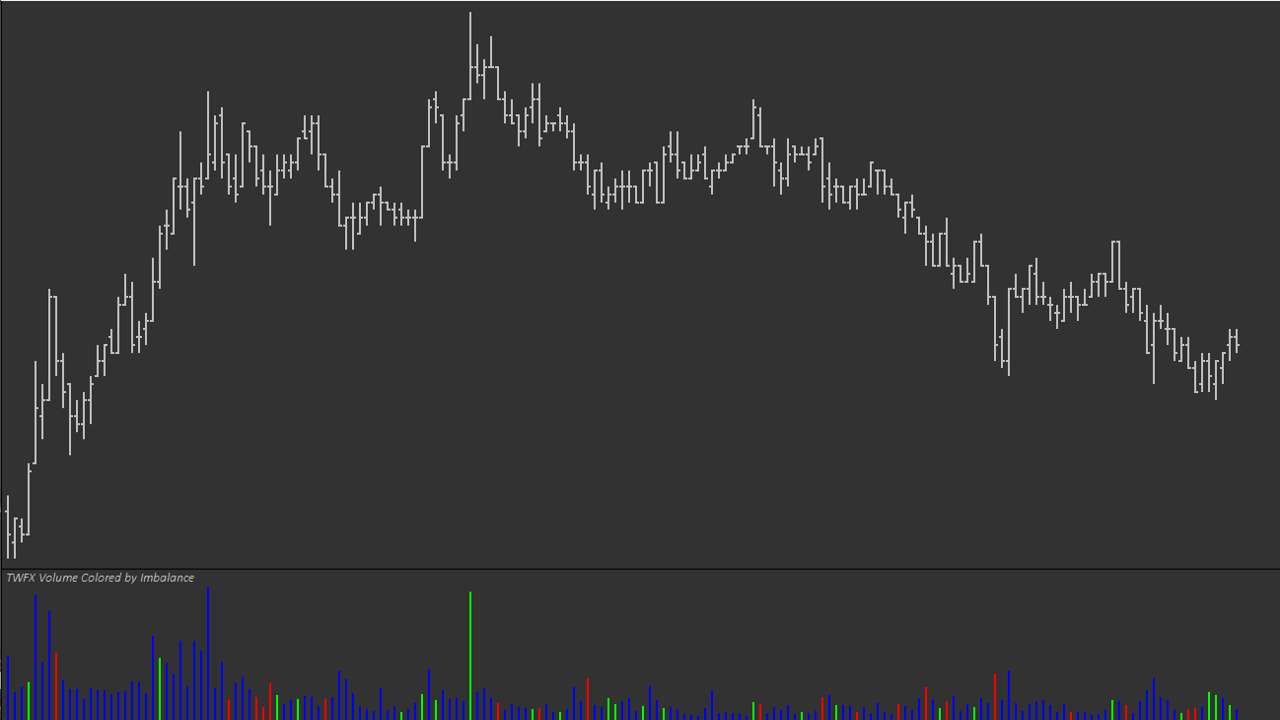
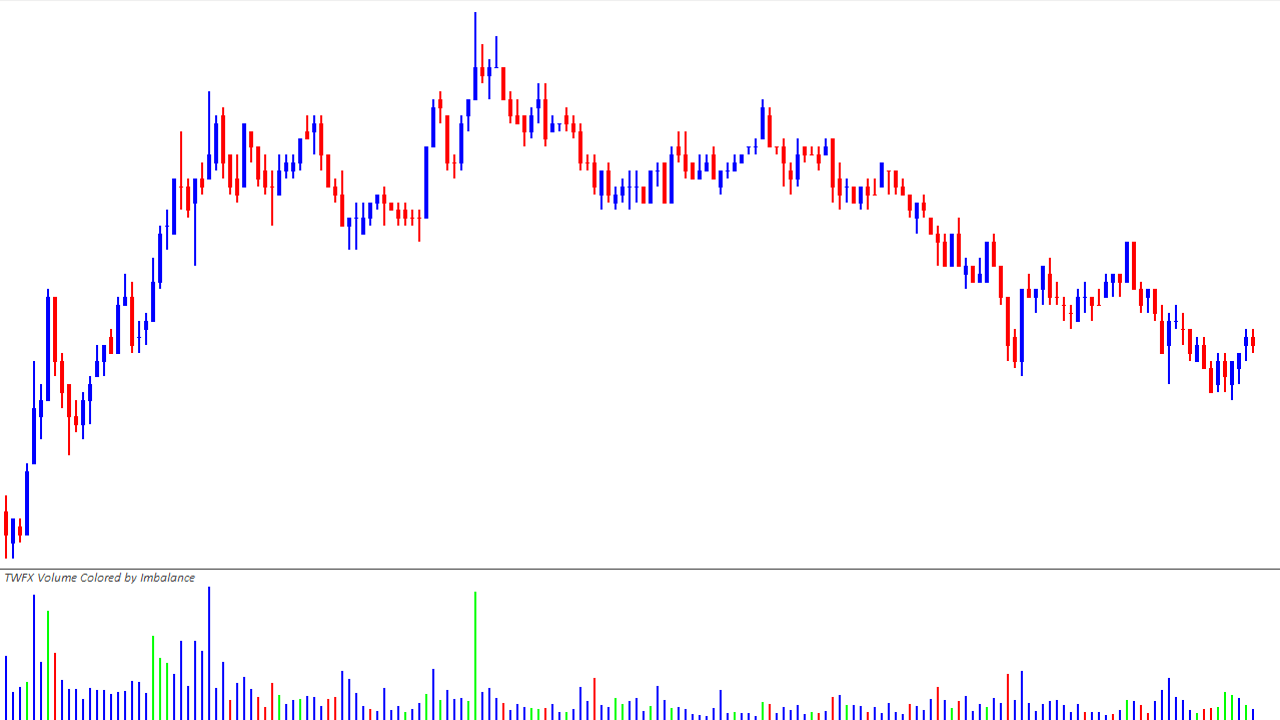
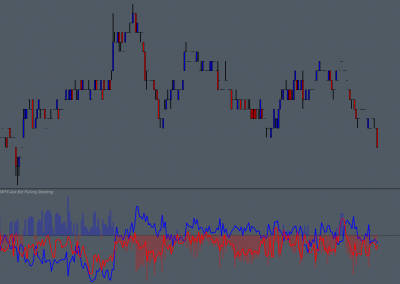
The Volume Colored by Imbalance Study monitors Ask, Bid and Total traded volume, and displays the data in the form of a Bar Chart / Histogram.
Individual bars are colored according to which (if any) side of the market is dominant within that particular chart bar period. Dominance can be determined either by a simple comparison of Ask Volume vs. Bid Volume, or a comparison to an adjustable dominance threshold.

Possible Uses
This view of actual volume, combined with dominance coloring can be useful for quickly identifying extreme delta conditions or simple divergence between price movement and delta, although the information displayed is only really useful as a coarse gauge for identifying extreme imbalances.
Part of the Free Studies Collection
[mepr-hide if="loggedin"]Not a member? Register now and get access to the free studies collection.[/mepr-hide]
[mepr-hide if="loggedin"]Register Now[/mepr-hide]
[mepr-hide if="loggedin"]Already a member? Log in now, add the Free Studies Collection to the basket, then checkout for free.[/mepr-hide]
0 Comments