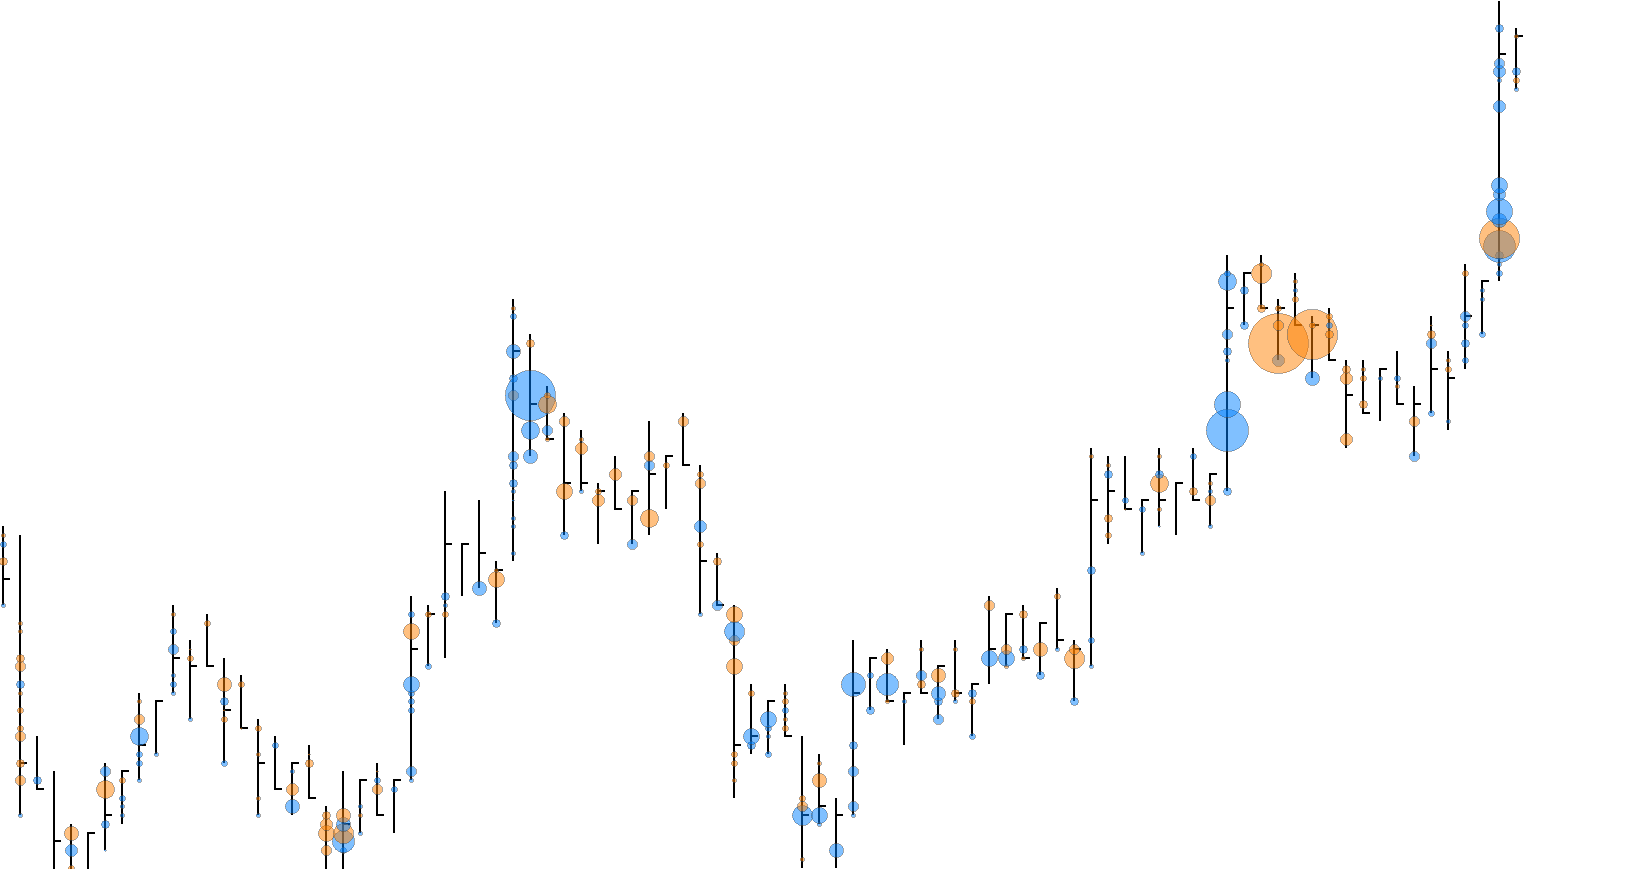
The Delta Dots study tracks volume at price data and highlights price bars or individual prices with a circular marker when the selected threshold conditions are met or exceeded: Minimum Traded Volume; Ask/Bid Delta Imbalance; Ask/Bid Delta Difference.
Fixed or automatically sized markers, based on traded volume.
Color markers according to dominant side or Ask/Bid components of volume.
Most suited for use on ‘time period’, ‘volume’, ‘number of trades’, ‘range’ or ‘reversal’ charts.
Up to 256 ‘Delta Dots’ can be drawn per chart bar index.
The study is summarised in the following update post – Delta Dots.
Note:
- Not compatible with Sierra Chart OpenGL graphics mode, use Delta Dots – LW Study instead
- This study can only be used on charts with a chart data type of ‘Intraday Chart‘
- It is recommended to use ‘Intraday Data Storage Time Unit‘ setting ‘1 Tick’
Inputs
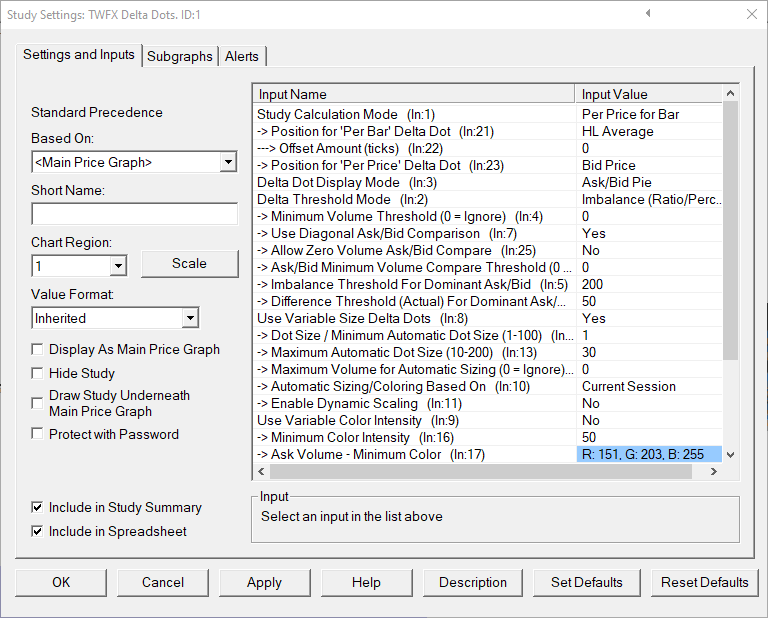
- Total for Bar: Study calculations are made using traded volume for entire intraday chart bar period (total volume and/or ask/bid volume).
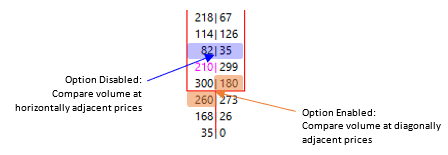
- Per Price for Bar: Study calculations are made using traded volume at each individual price level for each intraday chart bar period (total volume and/or ask/bid volume). The ask/bid volume can optionally be evaluated diagonally (bid volume vs. ask volume at next higher price).
When using the ‘Total for Bar’ calculation mode, the Delta Dot output can be displayed in 1 of 5 positions.
Delta Dots displayed at the high or low price of the intraday chart bar period can optionally be offset by a specified number of ticks.
- HL Average: Use average of High and Low prices for bar period
- High: Use High price for bar period
- Low: Use Low price for bar period
- VWAP: Use VWAP price for bar period
- VPOC: Use VPOC price for bar period
Specify the offset amount in ticks for ‘Total for Bar’ Delta Dot (only applies to High and Low positions).
- Min: 0
- Max: 50
- Bid Price: Delta Dots are drawn vertically aligned with the evaluated bid price.
- Ask/Bid Average Price: Delta Dots are drawn vertically aligned with the average of evaluated bid price and the evaluated ask price.
- NOTE: Applies only to ‘Per Price for Bar’ calculation mode and when ‘Use Diagonal Ask/Bid Comparison’ is enabled.
Select the display output type for Delta Dot.
‘Dominant Side’ can both be configured with varying color intensity relative to the Delta Dot with the highest delta imbalance value.
All output types can be configured to automatically adjust size relative to the Delta Dot with the highest traded volume.
‘Dominant Side’ refers to dominant aggressive orders, i.e. Market Orders
– Dominant Ask: Buy Market Orders dominate Sell Markets Order
– Dominant Bid: Sell Market Orders dominate Buy Market Orders
- Dominant Side: Delta Dots are coloured using according to the dominant side using the Ask & Bid colours.

- Ask/Bid Split: Delta Dots are split horizontally into segments, the segment areas being based on the Ask/Bid volume percentages.

- Ask/Bid Pie: Delta Dots are split into sectors about the vertical axis, the sector areas being base on the Ask/Bid volume percentages.

- Ask/Bid Gradient: Delta Dots are coloured using a vertical linear gradient transition from Ask color to Bid color, the position of the transition being based on the Ask/Bid volume percentages.

- Imbalance (Ratio/Percent): Ask / Bid Delta is evaluated against only the ‘Imbalance Threshold for Dominant Ask/Bid’
‘Difference Threshold (Actual) For Dominant Ask/Bid’ is ignored - Difference (Actual): Ask / Bid Delta is evaluated against only the ‘Difference Threshold (Actual) For Dominant Ask/Bid’
‘Imbalance Threshold for Dominant Ask/Bid’ is ignored - Imbalance & Difference: Ask / Bid Delta is evaluated against both the ‘Imbalance Threshold for Dominant Ask/Bid’ AND the ‘Difference Threshold (Actual) For Dominant Ask/Bid’
If both conditions are not met, then no Delta Dot will be displayed.
Specify the minimum traded volume required, per chart bar or price level before a Delta Dot will be drawn.
- Min: 1
- Max: 1000000
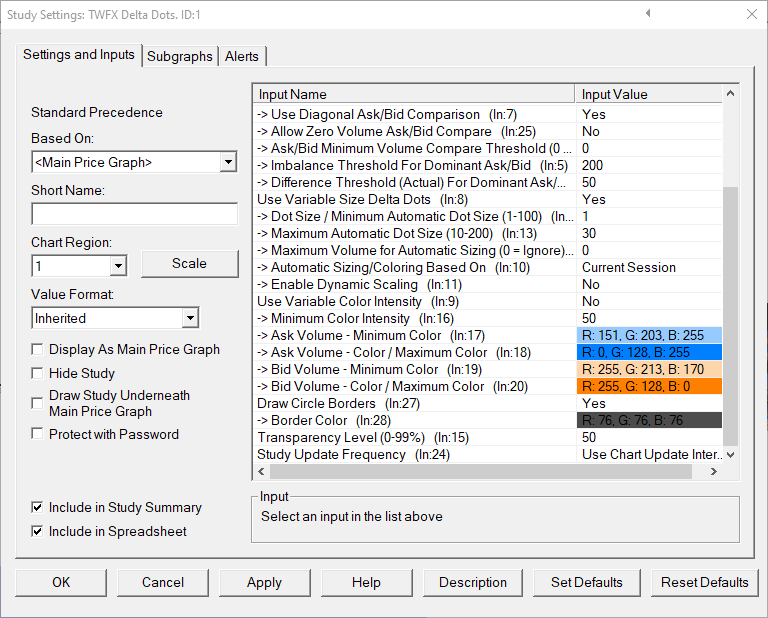
- Yes: Bid Volume at each price level is evaluated against Ask Volume at the next highest price level.
- No: Bid Volume at each price level is evaluated against Ask Volume at the same price level.
- NOTE: Applies only to ‘Per Price for Bar’ calculation mode.
- Yes: Allows Delta evaluation of Ask/Bid Volume when one either Ask or Bid has zero volume. To achieve this, zero volume levels are treated as having a volume of 1.”
– If Ask Volume = 0 then Ask Volume = 1
– If Bid Volume = 0 then Bid Volume = 0 - No: If either of Ask or Bid Volume has zero volume, then no Delta evaluation is performed.
Delta evaluation will only be performed if both the Ask Volume AND Bid Volume meet or exceed the ‘Ask/Bid Minimum Volume Compare Threshold’
- Min: 0
- Max: 1000000
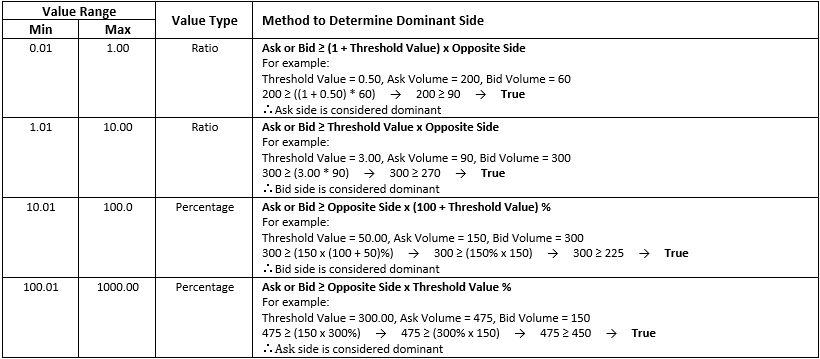
Depending on the value selected, ranging from 0.01-1000, the threshold value will either represent a ratio comparison or a percentage comparison.
The largest of either the Ask or Bid volume is always compared to the smallest multiplied by a value derived from the Imbalance Threshold.
The ‘Difference Threshold (Actual) For Dominant Ask/Bid’ is only relevant when the ‘Delta Threshold Mode’ is set to ‘Difference (Actual)’ or ‘Imbalance & Difference’.
Delta Difference is the absolute difference between the Ask volume and Bid volume being evaluated.
- Min: 1
- Max: 1000000
- Yes:
Delta Dots are automatically sized based on the following:
– Dot Size / Minimum Variable Dot Size
– Maximum Variable Dot Size
– Delta Dot total volume as a percentage of the Delta Dot with the highest total volume (either within the visible chart area or the whole period to which the chart applies) - No: Delta Dots are uniform size (Dot Size / Minimum Variable Dot Size)
Specify the size used for non-variable delta dots / minimum size for variable delta dots
- Min: 1
- Max: 100
Specify the maximum size used for variable delta dots
- Min: 10
- Max: 200
Specify the upper limit for the total volume used when sizing Delta Dots.
This can be used to prevent outlier volume levels distorting the overall view of the other volume levels.
- Min: 0
- Max: 1000000
- Visible Bars: Variable Size for Delta Dots is calculated using only the bars within the time/x-axis visible range
NOTE: Delta Dots that are within the visible time range, but beyond the visible price range are included in the calculation. - All Bars Included in Study Calculation: The time range for the entire chart is used.
This can be controlled using the setting ‘Chart Settings->Use Number of Days to Load’ - Current Session: Variable Size for Delta Dots is calculated using the current trading session only (based on the session times for the chart to which the study is applied)
- NOTE: ‘Variable Sizing Based On’ also applies to ‘Variable Coloring’, when used.
When the study is initially applied to the chart, reference values for the span of the time and price axis are automatically set, these reference values can be reset at any time to better suit the current chart configuration.
To reset the time and price axis reference values, ‘Chart Shortcut Menu’ context menu option ‘Reset Scale Reference’
NOTE: Does not apply when ‘Use Variable Size Delta Dots’ is set to ‘No’
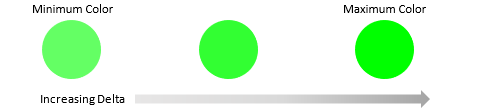
- Yes: Delta Dots are automatically colored based on the following:
– Ask/Bid Minimum Color
– Ask/Bid Color / Maximum Color
– Delta Dot imbalance value as a percentage of the Delta Dot with the highest delta imbalance value (either within the visible chart area or the whole period to which the chart applies)
– Minimum Color Intensity
- No: Delta Dots colored using only the Ask/Bid Color / Maximum Color
- NOTE: Applies only to ‘Dominant Side’ display mode
Specify the minimum color intensity to be displayed, ranging from 0 to 100% of the ‘Maximum Color’.
If, when calculating the interpolated color, the calculated intensity is lower than the ‘Minimum Color Intensity’, the ‘Minimum Color Intensity’ will be used in place of the calculated intensity.
- Min: 0%
- Max: 100%
Set the transparency level used for Delta Dot color fill.
It’s not recommended to use both ‘Transparency’ and ‘Variable Color Intensity’ as the color output can be unsatisfactory
- Min: 0%
- Max: 99%
- Use Chart Update Interval: Delta Dots are updated each time that the study is called based upon the ‘Chart Update Interval’.
- Update on Bar Close: New Delta Dots are only added once the Intraday Chart Bar Period completes.
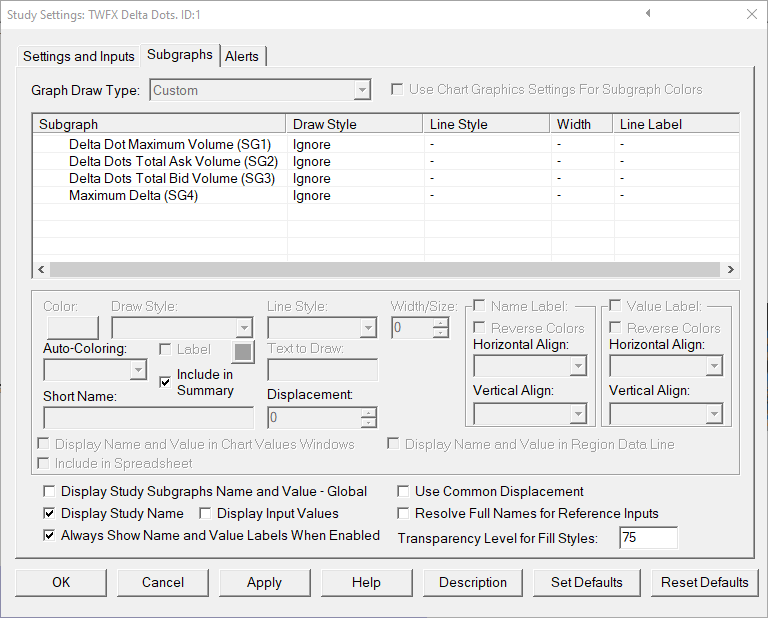
Subgraphs