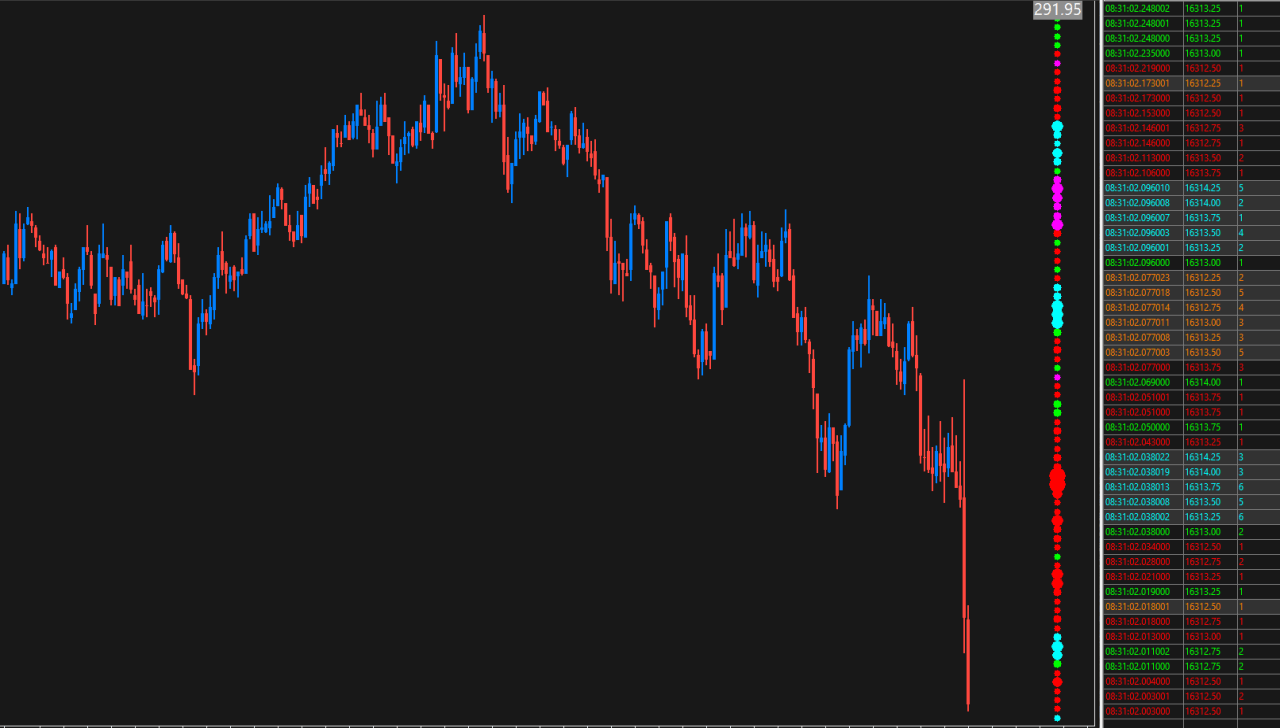
The Trade Tape Vertical Study is an alternative version of the Trade Tape Ex Study, displaying a visual Time & Sales representation, in the form of vertically scrolling markers and text.
Configuration options are provided to give flexibility in both how the trade tape is displayed and how it is calculated, including: if/how orders are combined before display; volume filtering; volume and slippage volume text configuration; and more.
An option is also provided to display the ‘pace of tape’ based on the total volume transacted per second – giving a quantifiable value to the tape speed.
The study is summarised in the following update post – Trade Tape.
Note:
- This study can only be used on charts with a chart data type of ‘Intraday Chart‘
- It is requirement to use ‘Intraday Data Storage Time Unit‘ setting ‘1 Tick’
- Use of the Sierra Chart ‘Denali’ data feed is recommended
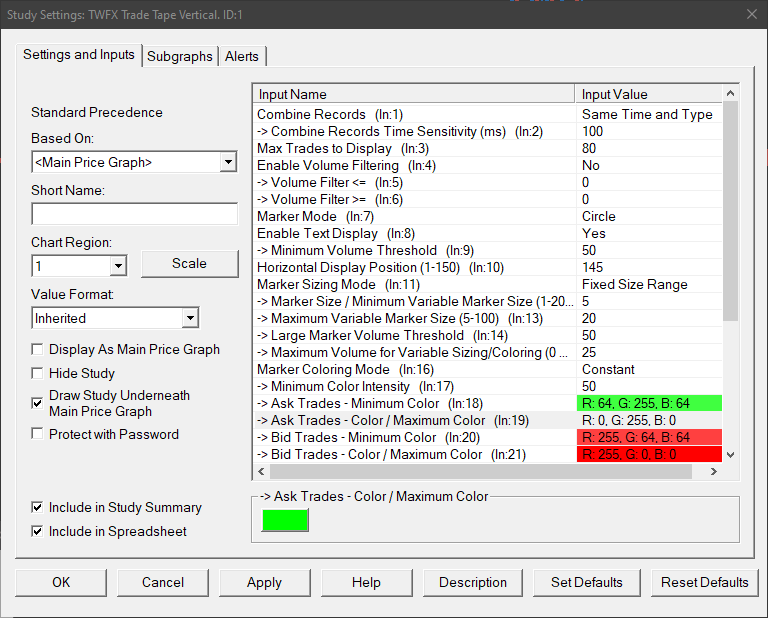
Inputs
- Do Not Combine:
Trade records are displayed exactly as received; each marker represents a single trade. - Same Time and Price:
Sequences of trade records are combined if the following conditions are met:- Trade price is identical;
- Trade type is identical (i.e. Ask or Bid);
- Trade occurs within the time window defined by input 2 – Combine Records Time Sensitivity (ms) – relative to the first combined trade.
- Same Time and Type:
Sequences of trade records are combined if the following conditions are met:- Trade type is identical (i.e. Ask or Bid);
- Trade occurs within the time window defined by input 2 – Combine Records Time Sensitivity (ms) – relative to the first combined trade.
- Combine into Exchange Reported Summary Trade:
Trades are combined into the original exchange reported summary trade.
Note: Applies only to CME and Eurex symbols when using the Sierra Chart Denali data feed, if used with any other symbol or data feed this setting has no effect and trades will be displayed as per ‘Do Not Combine’. - Market:
Sequences of trade records are combined under the following conditions:- Each ask (bid) trade occurs at a higher (lower) price compared to the previous trade in the sequence; and
- There is no ask / bid price update received in between the trades; and
- After the first trade, only the first trade at each price level is considered to be part of the original order, i.e. once 2 (or more) trades occur at a price level, the original order sequence is considered to be completed. Any remaining orders that transact before an ask / bid price update is received are considered to be part of separate trades (resting buy / sell stop orders) triggered subsequent to the first trade.
Note: For best results, it is recommended to use the Sierra Chart Denali Data Feed.
Defines the size of the time window in which trades can be combined, relative to the first combined traded.
Applies only to combining options ‘Same Time and Price’ and ‘Same Time and Type’.
- Min: 1ms
- Max: 1000ms
Max Trades to Display (In:3)
Defines the maximum number of trade tape records to display on the chart.
This setting will also impact the variable sizing and coloring calculations.
- Min: 25
- Max: 50
Note: Trade markers are displayed equispaced, the spacing is automatically adjusted based on the number of markers to display.
Enable Volume Filtering (In:4)
When Volume Filtering is enabled, trade records are filtered according to the ‘Volume <=’ and ‘Volume >=’ conditions.
NOTE: Volume filtering occurs after any combining operations have been performed, and is completely unaffected by the Chart Volume Filter Settings.
Defines the minimum volume filter value.
- Min: 0 (0 = Ignore)
- Max: 1000000
Volume >= (In:6)
Defines the maximum volume filter value.
- Min: 0 (0 = Ignore)
- Max: 1000000
Marker Mode (In:7)
Defines the marker type used by the trade tape to represent trades.
Options: Circle; Square; and Diamond.
Enable Text Display (In:8)
When enabled, text showing the actual trade volume can be displayed in addition to the trade tape markers.
Minimum Volume Threshold (In:9)
Defines the minimum trade volume required before trade tape text displayed.
- Min: 1
- Max: 1000000
Horizontal Display Position (1-150) (In:10)
Defines where in the chart window the vertical tape should be displayed, 1 being the leftmost edge and 150 being the rightmost edge.
- Min: 1
- Max: 150
Marker Sizing Mode (In:11)
- Relative Volume:
The size of the trade tape marker is calculated based upon the volume as a percentage of the highest volume trade tape marker currently displayed, the ‘Minimum Variable Marker Size’ and the ‘Maximum Variable Marker Size’. - Small & Large:
The size of the trade tape marker is either Small or Large, depending on whether or not the trade volume is greater than the specified ‘Large Marker Volume Threshold’.
Small trade tape markers are drawn using the ‘Marker Size / Minimum Variable Marker Size’ parameter.
Large trade tape markers are drawn using the ‘Maximum Variable Marker Size’ parameter. - Fixed Size Range:
The size of the trade tape marker is calculated based upon the volume relative to the ‘Maximum Volume for Sizing/Coloring’ parameter.
If the volume exceeds the ‘Maximum Volume for Sizing/Coloring’ then the ‘Maximum Variable Marker Size’ parameter will used.
NOTE:
If ‘Maximum Volume for Sizing/Coloring’ is not defined, then the Variable Sizing Mode will revert to ‘Relative Volume’ mode. - None:
All trade tape markers are sized according to the ‘Marker Size / Minimum Variable Marker Size’ parameter.
Marker Size / Minimum Variable Marker Size (In:12)
Defines the trade tape marker size when ‘Marker Sizing Mode’ is set to ‘None’, otherwise defines the minimum size used when calculating the trade tape marker size, or the size used for small trade tape markers.
- Min: 1
- Max: 20
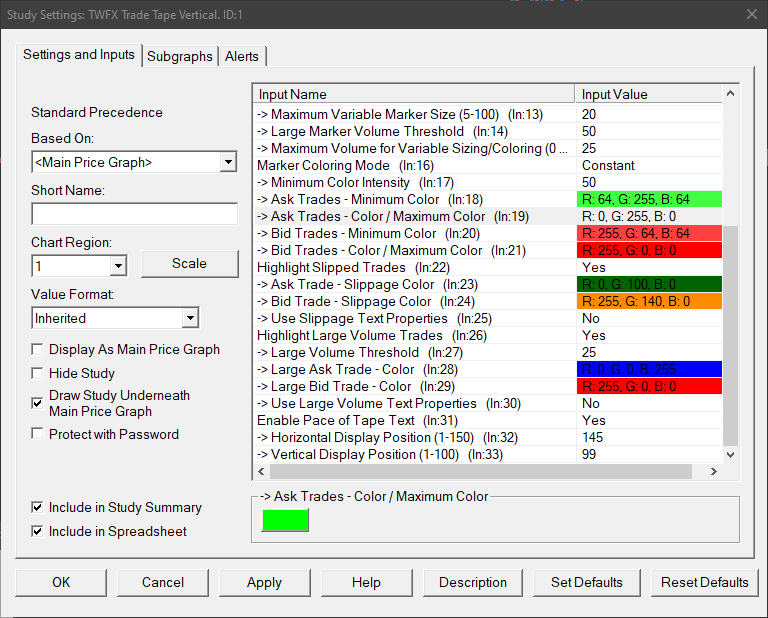
Maximum Variable Marker Size (In:13)
Defines the maximum size used when calculating the trade tape marker size, or the size used for large trade tape markers.
- Min: 20
- Max: 100
Large Marker Volume Threshold (In:14)
Defines the minimum trade volume required before a trade tape marker is considered ‘Large’ in the context of the ‘Small & Large’ variable sizing mode.
- Min: 1
- Max: 1000000
Maximum Volume for Variable Sizing/Coloring (In:15)
Defines the maximum volume used when calculating variable size or variable coloring trade tape markers.
If the traded trade volume exceeds this value, it will be substituted in place of the actual volume.
Note: This setting is ignored if set to 0.
- Min: 0
- Max: 1000000
Marker Coloring Mode (In:16)
Defines the method used for coloring trade tape markers.
- Constant:
Ask trade markers are colored using the ‘Ask Trades – Color / Maximum Color’.
Bid trade markers are colored using the ‘Bid Trades – Color / Maximum Color’. - Variable:
When enabled, the trade tape marker color is calculated based upon the volume as a percentage of the highest volume trade tape marker currently displayed and the minimum and maximum colors for each Ask and bid.
The actual color displayed is interpolated between the minimum and maximum colors.
Minimum Color Intensity (In:17)
The minimum color intensity value to be used when calculating interpolated colors.
- Min: 0%
- Max: 100%
Ask Trades – Minimum Color (In:18)
Defines the color used for ask trades having the lowest volume – the lower boundary color when calculating interpolated colors.
Ask Trades – Color / Maximum Color (In:19)
Defines the color used for ask trades having the highest volume – the upper boundary color when calculating interpolated colors.
Used for all ask trade tape markers when Marker Coloring Mode is set to constant.
Bid Trades – Minimum Color (In:20)
Defines the color used for bid trades having the lowest volume – the lower boundary color when calculating interpolated colors.
Bid Trades – Color / Maximum Color (In:21)
Defines the color used for bid trades having the highest volume – the upper boundary color when calculating interpolated colors.
Used for all bid trade tape markers when Marker Coloring Mode is set to constant.
Highlight Slipped Trades (In:22)
When this option is enabled, trades that occur above the last updated best ask or below the last updated best bid are displayed using the specified slippage colors, instead of the standard ask and bid colors.
Ask Trade – Slippage Color (In:23)
Defines the color used for trade tape markers where the trade has occurred above the last updated best ask price.
Bid Trade – Slippage Color (In:24)
Defines the color used for trade tape markers where the trade has occurred below the last updated best bid price.
Use Slippage Text Properties (In:25)
When enabled the slippage text will be sized and colored according to the ‘Slippage Text’ subgraph settings, rather than the ‘Volume Text’ subgraph settings.
Highlight Large Volume Trades (In:26)
When this option is enabled, trades having a total volume greater than or equal to the ‘Large Volume Threshold’ are displayed using the specified large volume colors, instead of the standard ask and bid colors.
Large Volume Threshold (In:27)
Defines the threshold for what is to be considered a large trade with regard to large volume trade highlighting.
- Min: 1
- Max: 1000000
Large Ask Trades – Color (In:28)
Defines the color used for large volume ask trades.
Large Bid Trades – Color (In:29)
Defines the color used for large volume bid trades.
Use Large Volume Text Properties (In:30)
When enabled the large volume text will be sized and colored according to the ‘Large Volume Text’ subgraph settings, rather than the ‘Volume Text’ subgraph settings.
Enable Pace of Tape Text (In:31)
When enabled text is displayed to indicate the pace of tape, measured in traded volume per second, based on the most recent trade tape records.
Horizontal Display Position (1-150) (In:32)
Defines where, horizontally, in the chart window the Pace of Tape text should be displayed, 1 being the leftmost edge and 150 being the rightmost edge.
- Min: 1
- Max: 150
Vertical Display Position (1-100) (In:33)
Defines where, vertically, in the chart window the Pace of Tape text should be displayed, 1 being the lowermost edge and 100 being the uppermost edge.
- Min: 1
- Max: 100
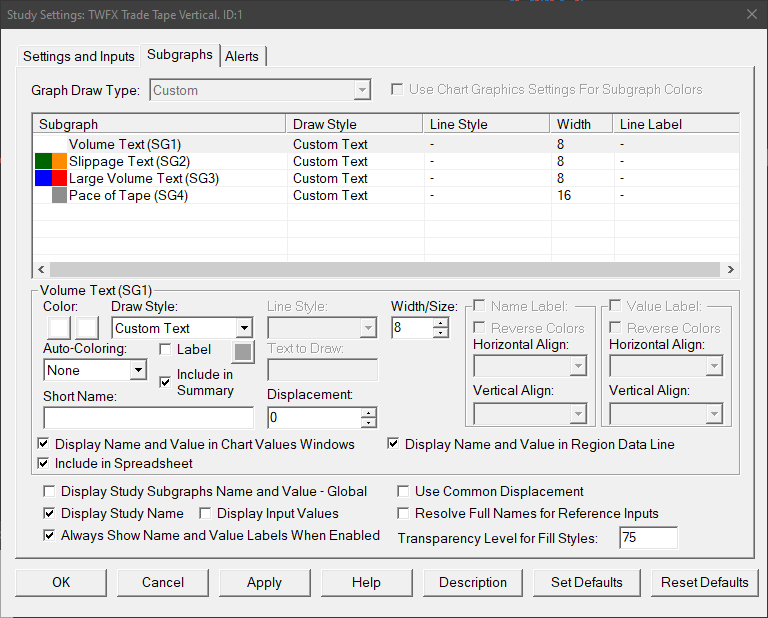
Subgraphs
Volume Text (SG1)
Default: Custom Text
Defines the colors and font size used for volume text display.
Ask Volume = Primary Color, Bid Volume = Secondary Color
Slippage Text (SG2)
Default: Custom Text
Defines the colors and font size used for slippage text display (when enabled).
Ask Volume = Primary Color, Bid Volume = Secondary Color
Large Volume Text (SG3)
Default: Custom Text
Defines the colors and font size used for large volume text display (when enabled).
Ask Volume = Primary Color, Bid Volume = Secondary Color
Pace of Tape (SG4)
Default: Custom Text
Defines the text color, background color, and font size used for pace of tape text display.
Text Color = Primary Color, Background Color = Secondary Color