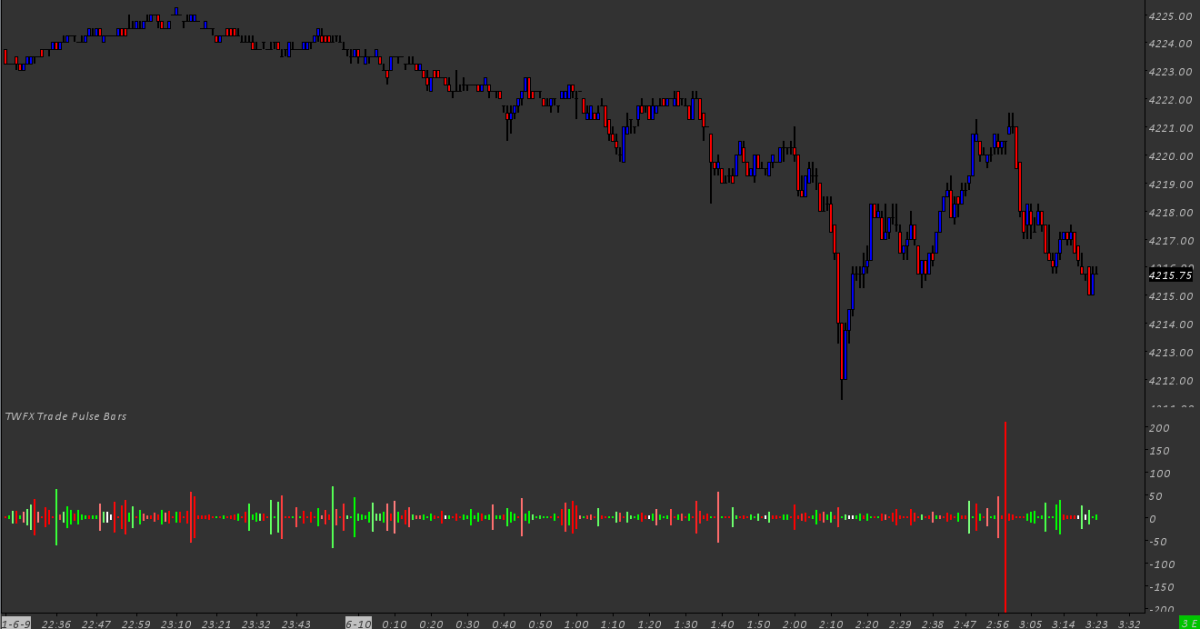
The Trade Pulse Study Bars displays a graphical representation of traded volume, based on a repeating, user configurable time window – pulse length.
In the default configuration, traded volume is represented by scrolling flow of bars, the height of the bar being relative to the volume traded. Each bar is colored to indicate ask/bid volume delta, with an option to use variable color intensity based on delta.
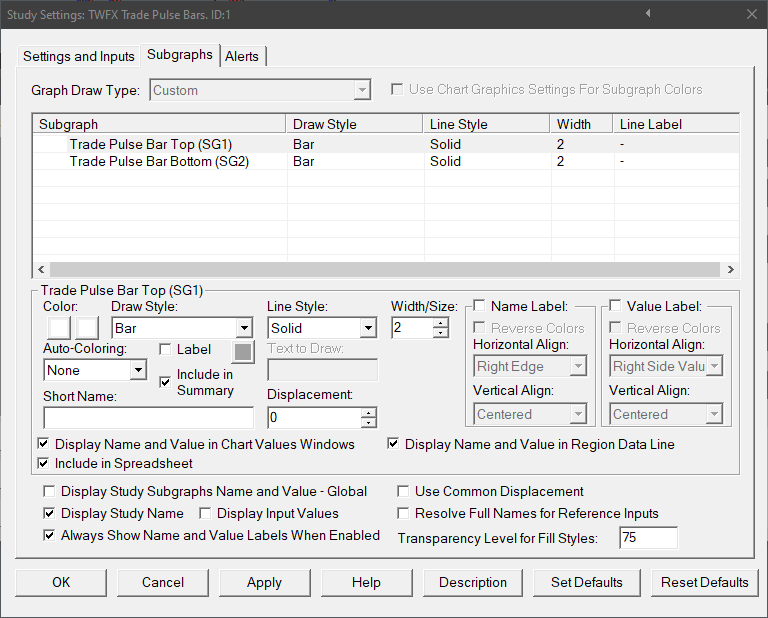
Configuration options are provided to control how the pulse study is displayed and calculated, including: pulse length; and marker spacing.
Note:
- This study can only be used on charts with a chart data type of ‘Intraday Chart‘
- It is recommended to use ‘Intraday Data Storage Time Unit‘ setting ‘1 Tick’
Inputs
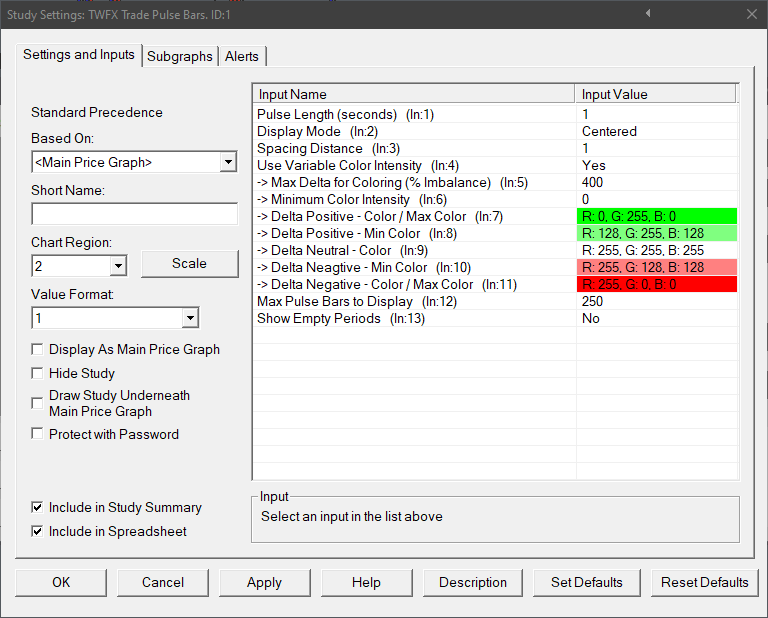
Pulse Length (seconds) (In:1)
Defines the time window over which traded volume is accumulated – the pulse.
Options: 250ms; 500ms; 1; 2; 3; 4; 5; 6; 7; 8; 9; or 10.
Display Mode (In:2)
- Centered:
Pulse bars are displayed centered about the zero axis, irrespective of the actual ask and bid volumes. - Relative to Ask Bid Volume:
Pulse bars are displayed about the zero axis, with the upper and lower portions sized according to ask and bid volume respectively.
Spacing Distance (In:3)
Defines the spacing amount, in chart bars, between each pulse bar.
- Min: 1
- Max: 20
Use Variable Color Intensity (In:4)
When enabled, the trade pulse bar color is calculated based upon delta relative to input 5 – ‘Max Delta for Coloring (% Imbalance), and the minimum and maximum colors.
The actual color displayed is interpolated between the minimum and maximum colors.
% Imbalance is defined as dominant side volume as a percentage of non-dominant side volume -> % Imbalance = Dominant Side Volume / Non-Dominant Side Volume * 100
Max Delta for Coloring (% Imbalance) (In:5)
Defines the maximum imbalance % value used when calculating the trade pulse bar color.
- Min: 101%
- Max: 1000%
Minimum Color Intensity (In:6)
The minimum color intensity value to be used when calculating interpolated colors.
- Min: 0%
- Max: 100%
Delta Positive – Color / Maximum Color (In:7)
Defines the color used for Delta Positive trade pulse bars having the highest delta – the upper boundary color used when calculating interpolated colors.
Used for all delta positive trade pulse bars when variable color intensity is disabled.
Delta Positive – Min Color (In:8)
Defines the color used for Delta Positive trade pulse bars having the lowest delta – the lower boundary color used when calculating interpolated colors.
Delta Neutral – Color (In:9)
Defines the color used when delta = 0, i.e. ask volume = bid volume.
Delta Negative – Min Color (In:10)
Defines the color used for Delta Negative trade pulse bars having the lowest delta – the lower boundary color used when calculating interpolated colors.
Delta Negative – Color / Maximum Color (In:11)
Defines the color used for Delta Negative trade pulse bars having the highest delta – the upper boundary color used when calculating interpolated colors.
Used for all delta negative trade pulse bars when variable color intensity is disabled.
Max Pulse Bars to Display (In:12)
Defines the maximum number of trade pulse bars to display on the chart.
- Min: 0 (0 = Auto)
- Max: 1000
NOTE:
The actual minimum value for ‘Max Pulse bars to Display’ is 25, therefore the study will default to 25 when a value between 0 and 25 is used.
Show Empty Periods (In:13)
When enabled the spacing of the trade pulse bars is based on the ‘Pulse Length’, meaning that when there is no trade for a period of time, empty spaces will be added between pulse bars to reflect the lack of trade in the corresponding periods.


