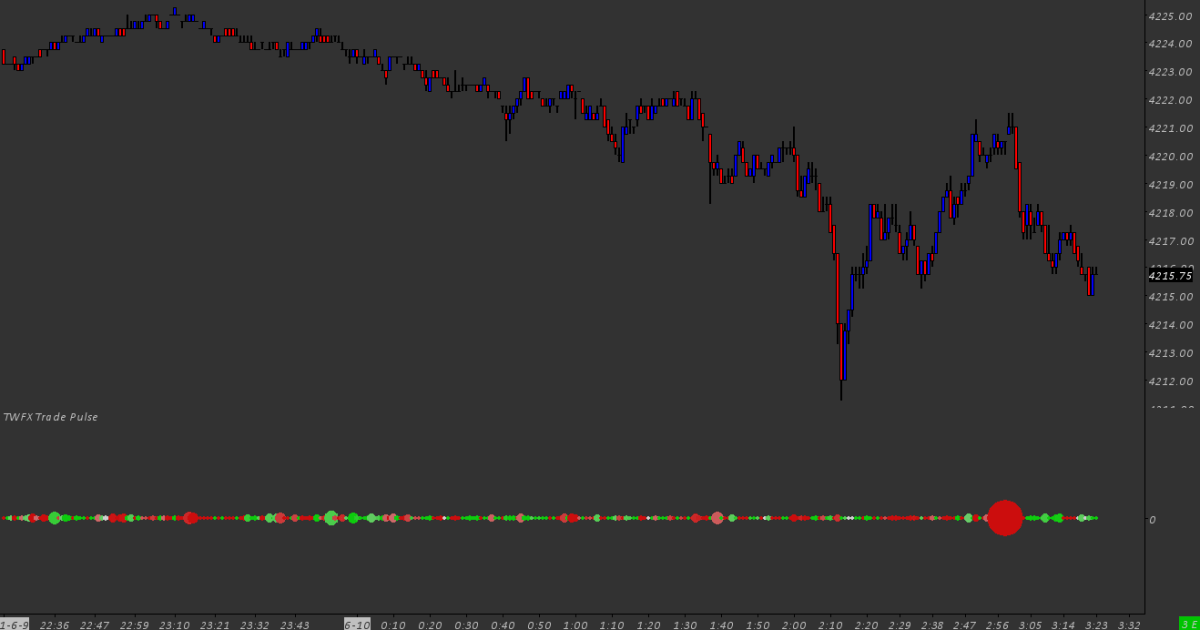
The Trade Pulse Study displays a graphical representation of traded volume, based on a repeating, user configurable time window – pulse length.
In the default configuration, traded volume is represented by scrolling flow of circular markers, each sized according to relative volume. Additionally, each marker is colored to indicate ask/bid volume delta, optionally either volume or delta % can also be displayed as text.
Configuration options are provided to control how the pulse study is displayed and calculated, including: pulse length; automatic marker sizing; marker spacing; and more.
Note:
- This study can only be used on charts with a chart data type of ‘Intraday Chart‘
- It is recommended to use ‘Intraday Data Storage Time Unit‘ setting ‘1 Tick’
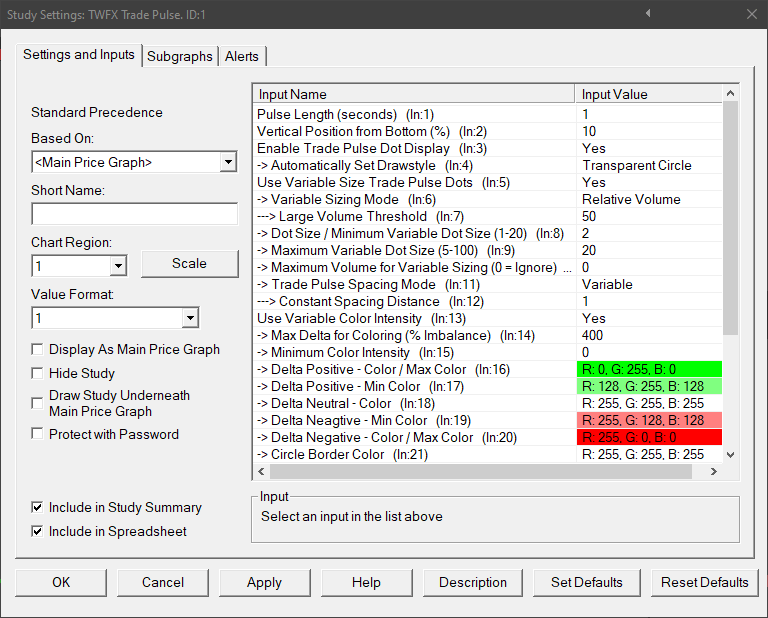
Inputs
Pulse Length (seconds) (In:1)
Defines the time window over which traded volume is accumulated – the pulse.
Options: 250ms; 500ms; 1; 2; 3; 4; 5; 6; 7; 8; 9; or 10.
- Min: 0
- Max: 100
Enable Trade Pulse Dot Display (In:3)
Trade pulse dots can be disabled if text only output is preferred.
Sets the drawstyle for the trade pulse dots from a list of recommended options.
To use alternative options set to ‘No’ and select the desired drawstyle on the subgraphs tab of the study settings window.
Use Variable Size Trade Pulse Dots (In:5)
When enabled the trade pulse dot sizing is determined according to the ‘Variable Sizing Mode’ and associated parameters, otherwise the ‘Dot Size / Minimum Variable Dot Size’ is used.
Variable Sizing Mode (In:6)
- Relative Volume: The size of the trade pulse dot is calculated based upon the volume as a percentage of the highest volume trade pulse dot currently displayed, the ‘Minimum Variable Dot Size’ and the ‘Maximum Variable Dot Size’. Depending on the ‘Max Records to Display’ setting and the width of the chart to which the study is applied, the highest volume trade pulse dot may not be visible on screen.
- Small & Large: The size of the trade pulse dot is either Small or Large, depending on whether or not the trade volume is greater than the specified ‘Large Volume Threshold’. Small trade pulse dots are drawn using the ‘Dot Size / Minimum Variable Dot Size’ parameter. Large trade pulse dots are drawn using the ‘Maximum Variable Dot Size’ parameter.
- Fixed Size Range: The size of the trade pulse dot is calculated based upon the volume relative to the range between the ‘Minimum Volume Threshold’ and ‘Maximum Volume for Scaling/Coloring’. If the volume exceeds the ‘Maximum Volume for Scaling/Coloring’ then the ‘Maximum Variable Dot Size’ parameter will used.
Large Volume Threshold (In:7)
Defines the minimum trade volume required before a trade pulse dot is considered ‘Large’ in the context of the ‘Small & Large’ variable sizing mode.
- Min: 1
- Max: 1000000
Defines the trade pulse dot size when ‘Use Variable Size Trade pulse Dots’ is disabled, otherwise defines the minimum size used when calculating the trade pulse dot size, or the size used for small trade pulse dots.
- Min: 1
- Max: 20
Defines the maximum size used when calculating the trade pulse dot size, or the size used for large trade pulse dots.
- Min: 5
- Max: 100
Maximum Volume for Variable Sizing (In:10)
Defines the maximum volume used when calculating variable size trade pulse dots.
If the traded trade volume exceeds this value, it will be substituted in place of the actual volume.
Note: This setting is ignored if set to 0.
- Min: 0
- Max: 1000000
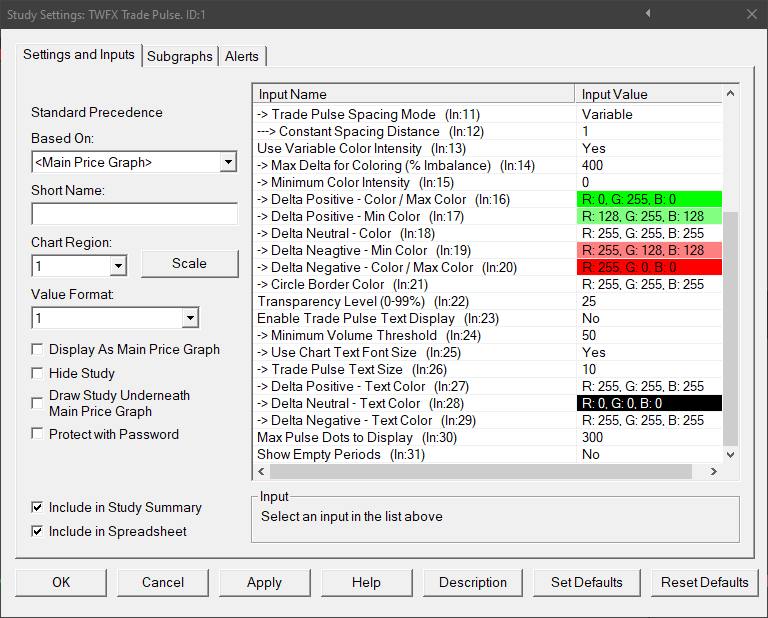
Trade Pulse Spacing Mode (In:11)
- Constant: Trade pulse dots are spaced a regular intervals, as defined by input 12 – Constant Spacing Distance.
- Variable: Trade pulse dots spacing will be automatically increased to prevent larger markers overlapping (as much as possible).
Constant Spacing Distance (In:12)
Defines the spacing amount, in chart bars, used when ‘Constant’ spacing is enabled.
- Min: 1
- Max: 20
Use Variable Color Intensity (In:13)
When enabled, the trade pulse dot color is calculated based upon delta relative to input 14 – ‘Max Delta for Coloring (% Imbalance), and the minimum and maximum colors.
The actual color displayed is interpolated between the minimum and maximum colors.
% Imbalance is defined as dominant side volume as a percentage of non-dominant side volume -> % Imbalance = Dominant Side Volume / Non-Dominant Side Volume * 100
Max Delta for Coloring (% Imbalance) (In:14)
Defines the maximum imbalance % value used when calculating the trade pulse dot color.
- Min: 101%
- Max: 1000%
Minimum Color Intensity (In:15)
The minimum color intensity value to be used when calculating interpolated colors.
- Min: 0%
- Max: 100%
Delta Positive – Color / Maximum Color (In:16)
Defines the color used for Delta Positive trade pulse dots having the highest delta – the upper boundary color used when calculating interpolated colors.
Used for all delta positive trade pulse dots when variable color intensity is disabled.
Delta Positive – Min Color (In:17)
Defines the color used for Delta Positive trade pulse dots having the lowest delta – the lower boundary color used when calculating interpolated colors.
Delta Neutral – Color (In:18)
Defines the color used when delta = 0, i.e. ask volume = bid volume.
Delta Negative – Min Color (In:19)
Defines the color used for Delta Negative trade pulse dots having the lowest delta – the lower boundary color used when calculating interpolated colors.
Delta Negative – Color / Maximum Color (In:20)
Defines the color used for Delta Negative trade pulse dots having the highest delta – the upper boundary color used when calculating interpolated colors.
Used for all delta negative trade pulse dots when variable color intensity is disabled.
Circle Border Color (In:21)
Applies to ‘Circle with Border’ drawstyle only.
Transparency Level (0-99%) (In:22)
Set the transparency level used when drawing trade pulse dots.
Using transparency in conjunction with variable coloring is not recommended, as it can make the variable color graduations much less apparent.
Enable Trade Pulse Text Display (In:23)
- No: No text is displayed.
- Volume: The total volume accumulated within the pulse period is displayed.
- Delta: Delta as a percentage of total volume accumulated within the pulse period is displayed.
Minimum Volume Threshold (In:24)
Defines the minimum trade pulse volume required before trade pulse text is displayed.
- Min: 1
- Max: 100000
Use Chart Text Font Size (In:25)
Automatically set the trade pulse text size based on the chart font.
This setting is ignored when using OpenGL graphics and instead the ‘Trade Pulse Text Size’ input is always used.
Trade Pulse Text Size (In:26)
Defines the font size (in pixels) used when displaying the trade pulse text display.
- Min: 5
- Max: 20
Delta Positive – Text Color (In:27)
Defines the text color used for delta positive trade pulse text.
Delta Neutral – Text Color (In:28)
Defines the text color used for delta neutral trade pulse text.
Delta Negative – Text Color (In:29)
Defines the text color used for delta negative trade pulse text.
Max Pulse Dots to Display (In:30)
- Min: 0 (0 = Auto)
- Max: 1000
- The number of pulse dots displayed is based on the chart width in bars; and
- Trade Pulse Spacing Mode will default to ‘Constant’.
Show Empty Periods (In:31)
When enabled the spacing of the trade pulse dots is based on the ‘Pulse Length’, meaning that when there is no trade for a period of time, empty spaces will be added between pulse dots to reflect the lack of trade in the corresponding periods.
NOTE:
If ‘Trade Pulse Spacing Mode’ is set to ‘Variable’, then ‘Show Empty Periods’ has no effect.
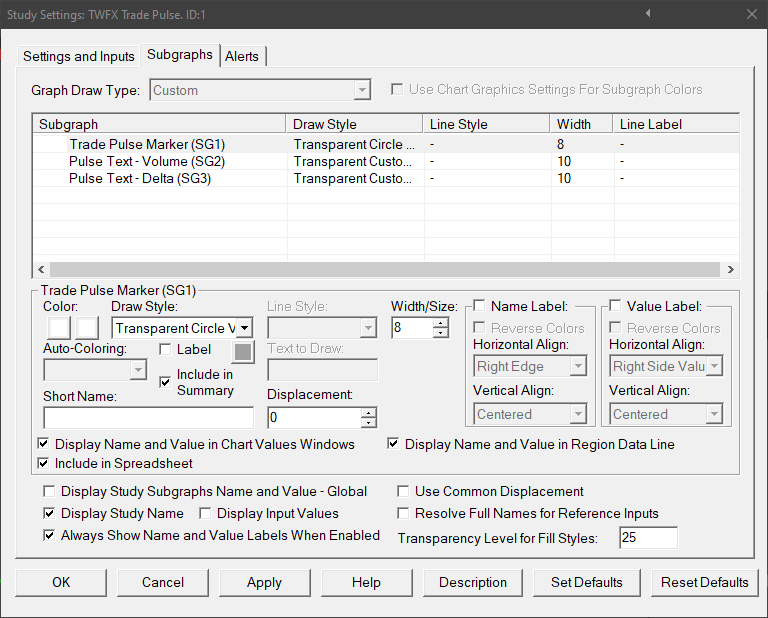
Subgraphs
Trade Pulse Marker (SG1)
Plots the trade pulse dots, when enabled, using the drawstyle defined by the ‘Automatically Set Drawstyle’ setting.
Pulse Text – Volume (SG2)
Plots the trade pulse volume text display, when enabled, using the font size and colors defined.
Pulse Text – Delta (SG3)
Plots the trade pulse delta text display, when enabled, using the font size and colors defined.