The Ask Bid Depth Imbalance study monitors the market liquidity / available orders over up to 100 Ask and Bid price levels in the DOM, the total Ask and Bid depth values are displayed as a percentage of total market depth across all levels evaluated.
Note:
- Data is recorded by the study each time the chart is updated (according to the Chart Update Interval) and remains persistent in the memory until the the chart symbol is changed, or the application (or chart) is closed, the data is not permanently saved. In addition, the chart update interval should be set to a value lower than the Bar Duration.
- This study can only be used on charts with a chart data type of ‘Intraday Chart‘
- It is recommended to use ‘Intraday Data Storage Time Unit‘ setting ‘1 Tick’
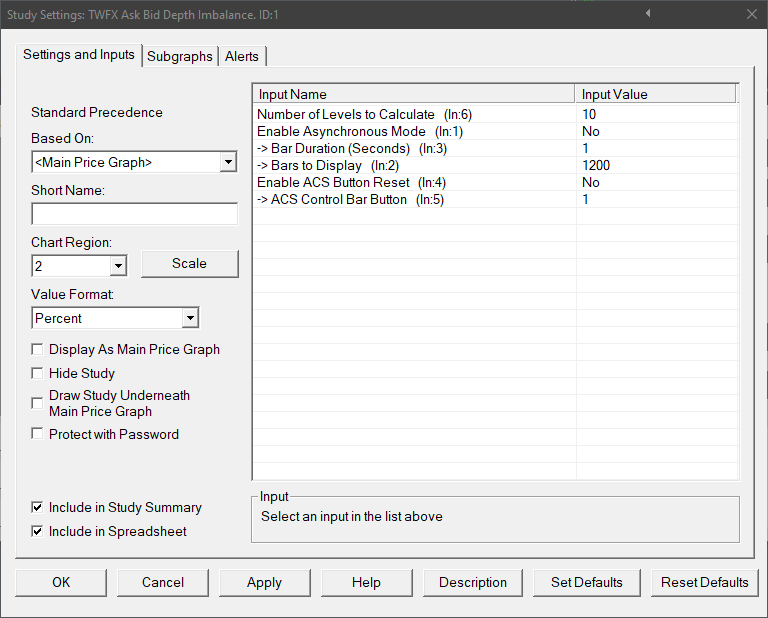
Inputs
Number of Levels to Calculate (In:6)
Select how many price levels to include in the ask bid depth sums:
- Min: 1
- Max: 100
Select the time period for the study subgraph display, applies to Asynchronous mode only:
- Min: 1 Second
- Max: 15 seconds
Select how many bars to display in the subgraph output, applies to Asynchronous mode only:
- Min: 60
- Max: 1800
Enable ACS Button Reset (In:4)
When this setting is enabled the ACS Control bar button corresponding to that set by the ‘ACS Control Bar Button’ input can be used to clear the stored Ask Bid depth data.
ACS Control Bar Button (In:5)
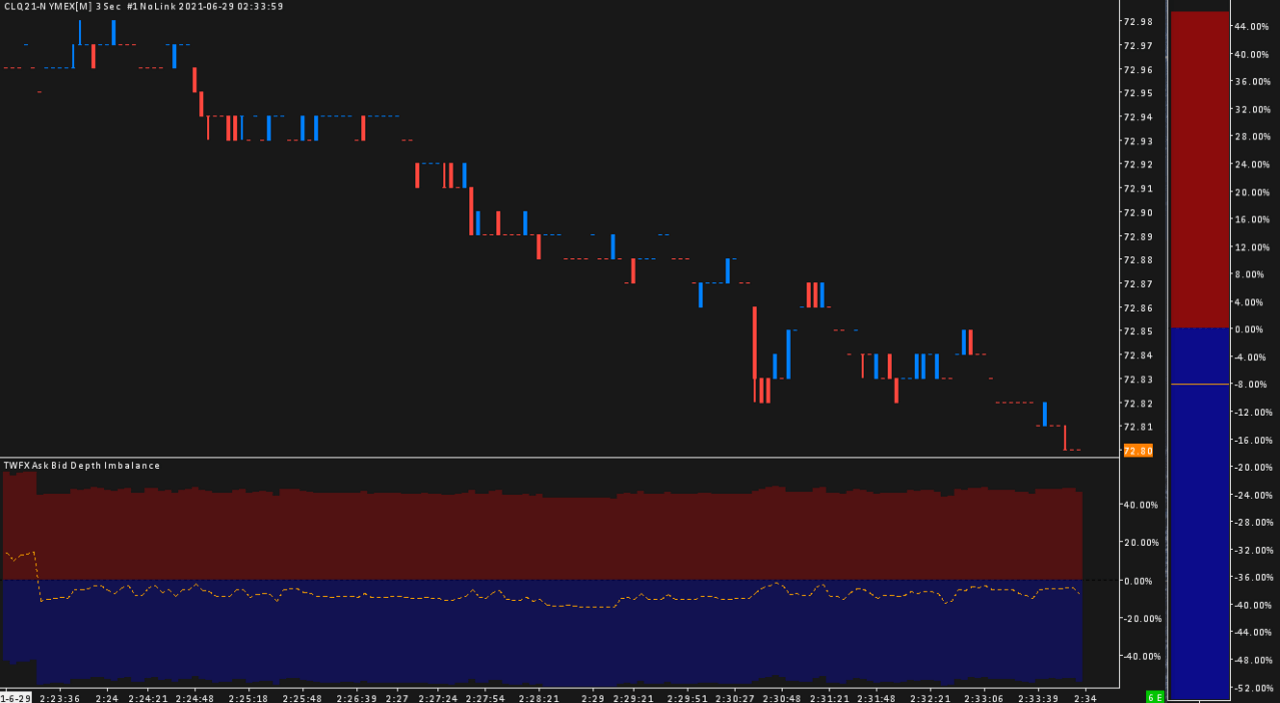
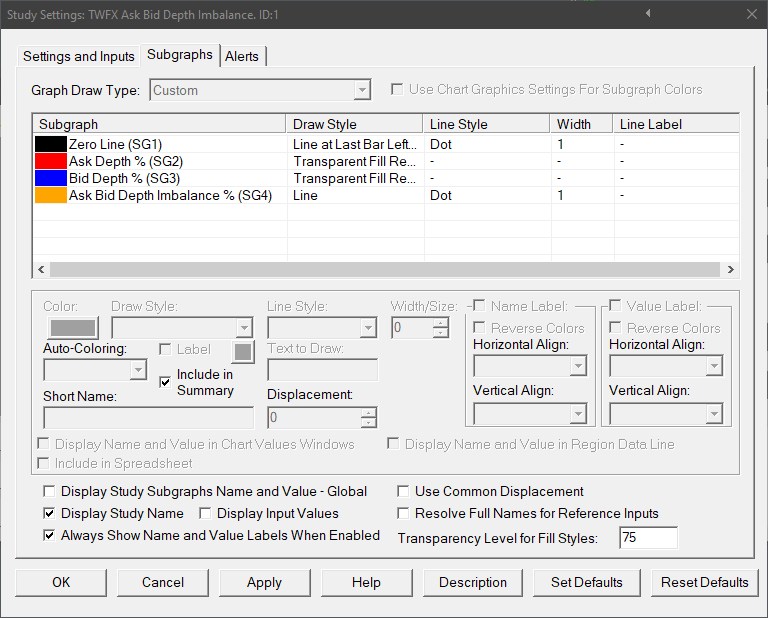
Subgraphs
Displays horizontal axis at zero to suit zero centered subgraph display
Ask Depth (SG2)
Default: Line
Displays the sum of the Ask market depth values as a percentage of total depth
Bid Depth (SG3)
Default: Line
Displays the sum of the Bid market depth values as a percentage of total depth
Ask Bid Depth Imbalance (SG4)
Default: Line
Displays the difference bewteen the Ask and Bid depth values as a percentage of the total depth