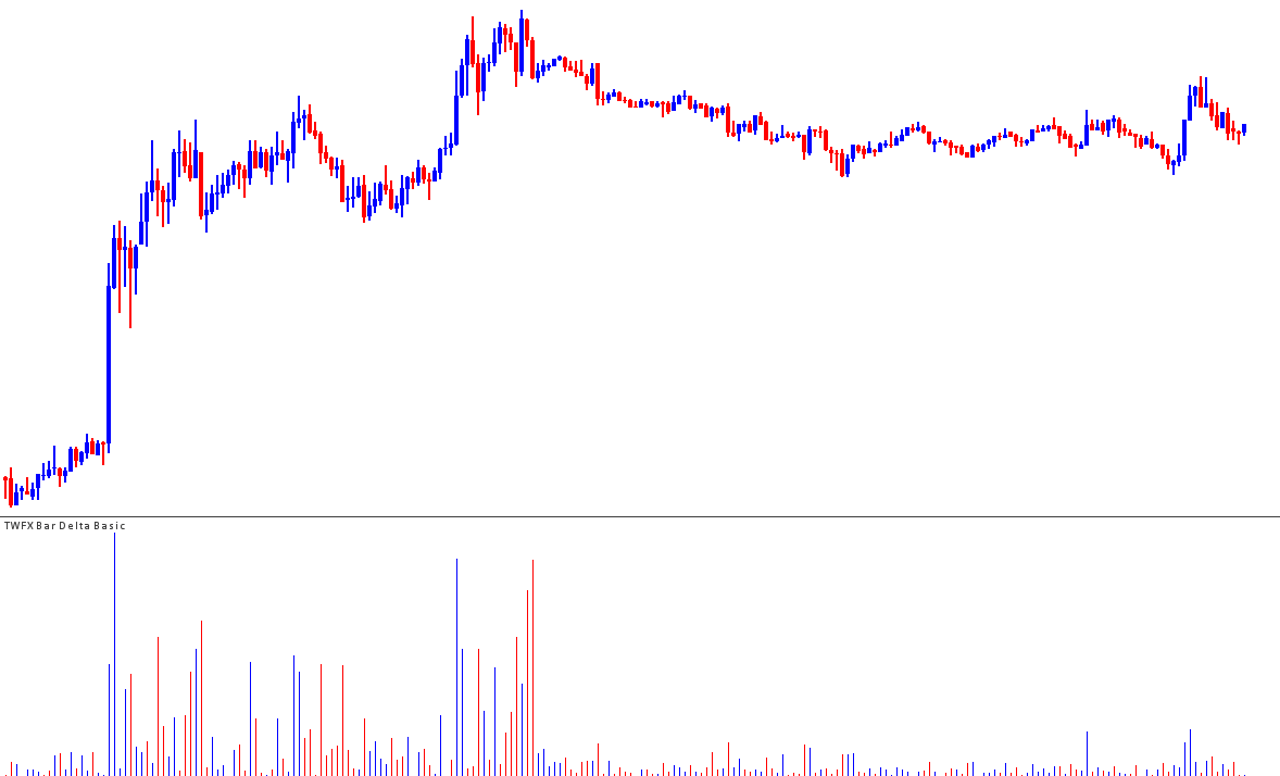
The Bar Delta Basic Study displays the difference between Ask Volume and Bid Volume (Delta) at each chart bar, with an option to display Delta as a percentage of the total traded volume, rather than the actual value.
Note:
- This study can only be used on charts with a chart data type of ‘Intraday Chart‘
- It is recommended to use ‘Intraday Data Storage Time Unit‘ setting ‘1 Tick’
Inputs
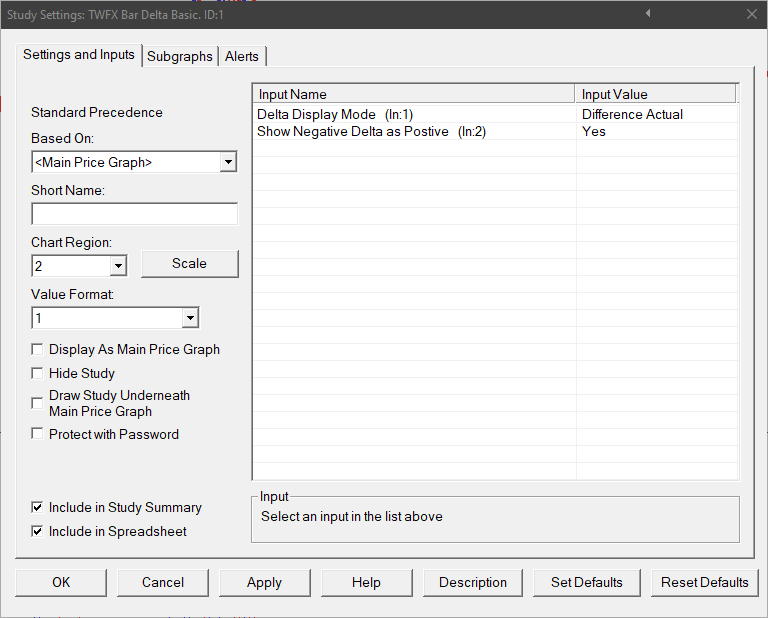
Delta Display Mode (In:1)
Defines the subgraphs display output value.
- Difference Actual: Delta is calculated and displayed as Ask Volume – Bid Volume.
- % of Total Volume: Delta is calculated and displayed as (Ask Volume – Bid Volume) / Total Volume.
Show Negative Delta as Positive (In:2)
When enabled, the absolute value for delta is displayed.


