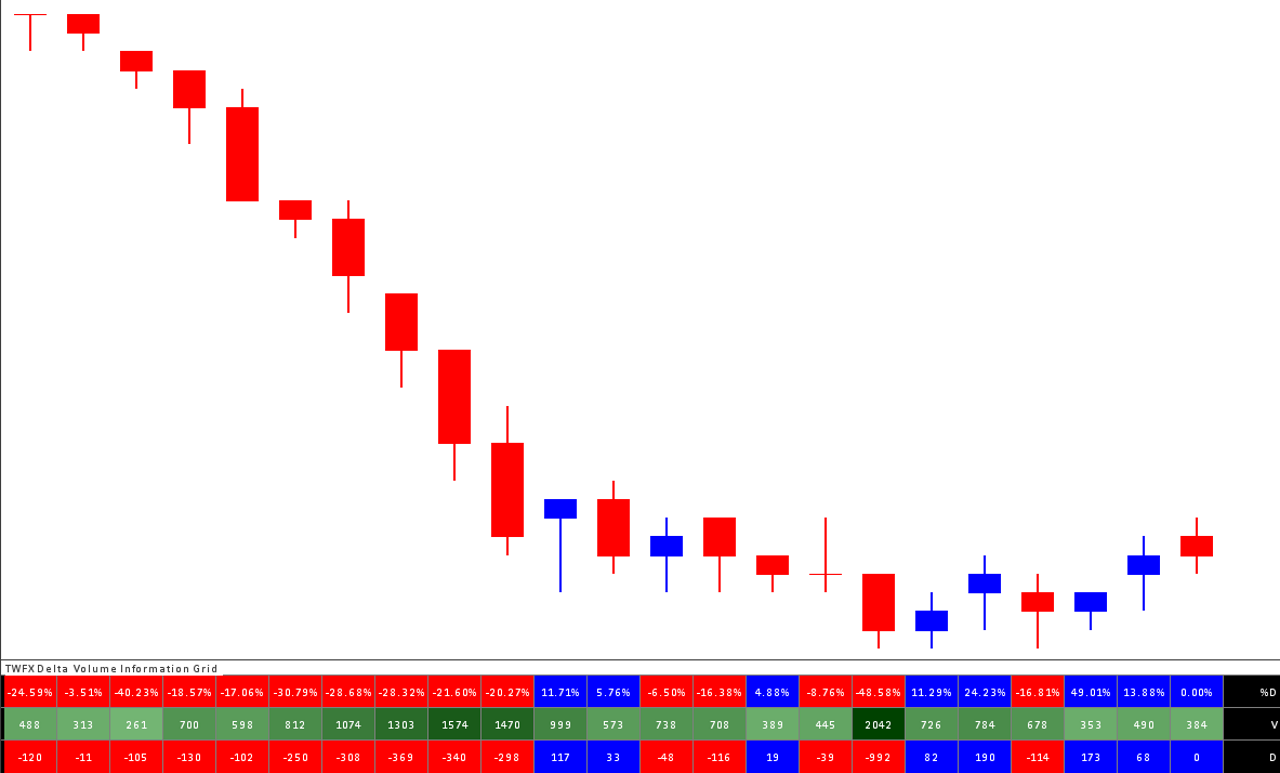
The Delta Volume Information Grid Study is a simplified and modified version of the native Sierra Chart Number Bars Calculated Values Study, providing only 3 subgraph outputs in a numeric information grid display format: Delta %; Volume; and Delta.
The study provides an option to color the grid cell background based on positive or negative delta, with an additional option to color volume separately based on volume as a percentage of the minimum to maximum volume range.
Note:
- This study can only be used on charts with a chart data type of ‘Intraday Chart‘
- It is recommended to use ‘Intraday Data Storage Time Unit‘ setting ‘1 Tick’
Inputs
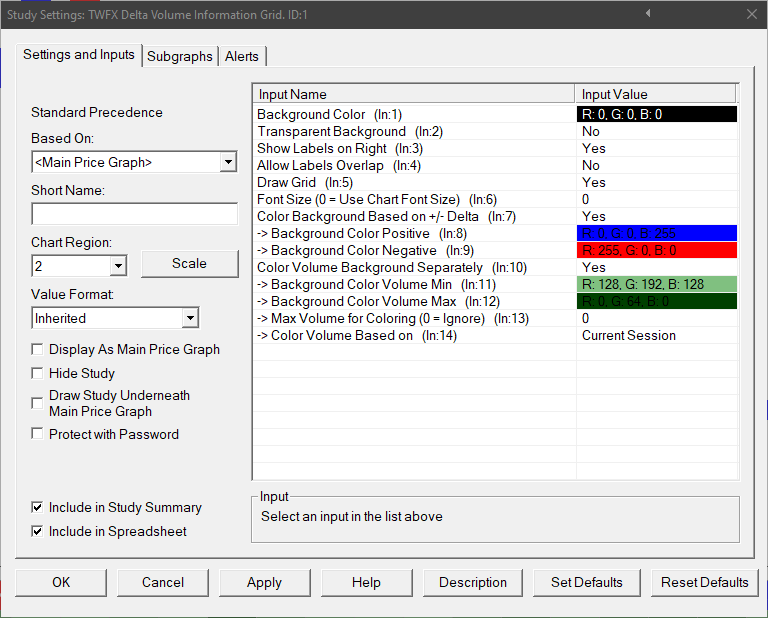
Background Color (In:1)
Defines the background color used for the numeric information grid. If ‘Color Background Based on +/- Delta’ is enabled, then background color only applies to the labels column.
Transparent Background (In:2)
If enabled, the ‘Background Color’ is ignored, and instead the numeric information grid background is colored the same as the underlying chart.
If ‘Color Background Based on +/- Delta’ is enabled, then transparent background only applies to the labels column.
Show Labels on Right (In:3)
Subgraph labels are displayed at the right hand edge of the chart window when this setting is enabled, otherwise they are displayed the left hand edge.
Allow Labels Overlap (In:4)
When enabled, this will draw the row values even if they are within the left side label area.
Draw Grid (In:5)
Defines whether or not a grid is drawn separating each row and column in the numeric information grid.
The color, line style and line weight used to draw the grid are all controlled by the ‘Grid Style’ subgraph.
Font Size (0 = Use Chart Font Size) (In:6)
Controls the font size used when displaying the numeric information grid text.
- Min: 0
- Max: 100
Color Background Based on +/- Delta (In:7)
Enabling this setting causes the background of each cell in the numeric information grid to be colored based on whether Delta is positive or negative. For the purposes of this study, zero delta is considered positive.
Background Color Positive (In:8)
Defines the background color used for when delta >= 0.
Background Color Negative (In:9)
When enabled, the subgraph colors for text display will be automatically over-written using the ‘Text Color’ input value.
Color Volume Background Separately (In:10)
Enabling this setting causes the background of each Volume cell in the numeric information grid to be colored based volume as a percentage of the minimum to maximum volume range. Minimum and Maximum volume are defined as the minimum and maximum bar volume values found within the data range defined by input 14: ‘Color Volume Based On’.
Background Color Volume Min (In:11)
Defines the background color used for the minimum volume value found in the defined data range.
Background Color Volume Max (In:12)
Defines the background color used for the maximum volume value found in the defined data range.
NOTE: For values between the minimum and maximum volume, the background color is interpolated based on the volume as percentage of the minimum to maximum volume range.
Max Volume for Coloring (In:13)
Defines the maximum possible volume value that will be used when determining the cell background color, useful for filtering outlier high volume values that would otherwise reduce the color resolution for all other values.
- Min: 0 (Ignore)
- Max: 1000000
Color Volume Based On (In:14)
Defines the range of values used when determining the minimum and maximum volume values upon which the volume background coloring is based.
- All Loaded Data: The minumum and maximum volume values are determined based on the entire loaded data set.
- Current Day: The minimum and maximum volume values are determined based on the current trading day only.
- Current Session: The minumum and maximum volume values are determined based on the current trading session only.
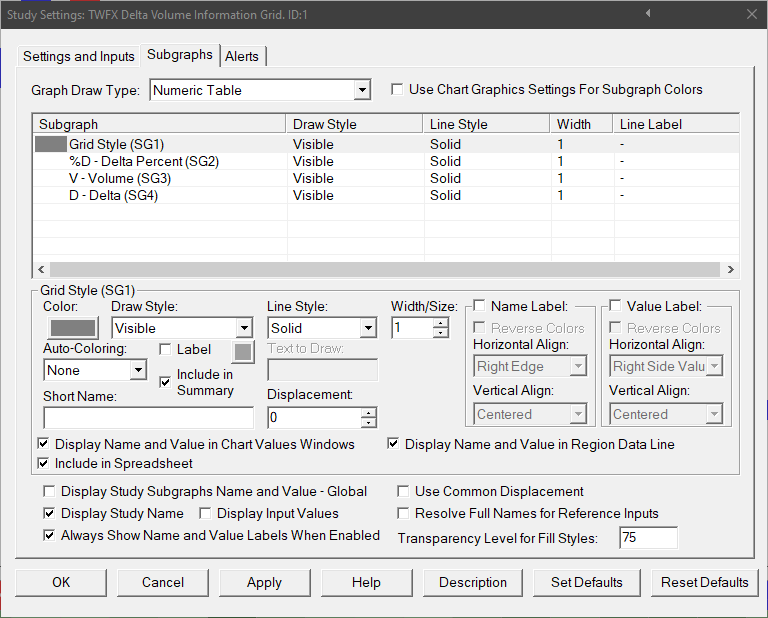
Subgraphs
Default: Visible; Primary Color: Grey;
Determines the line style, color and weight used when drawing the gridlines for the muneric information grid.
Delta Percent (SG2)
Default: Visible; Primary Color: White; Secondary Color: White
Displays Delta % values in the numeric information grid.
Primary color is used for positive values and secondary color for negative values.
Volume (SG3)
Default: Visible; Primary Color: White;
Displays Volume values in the numeric information grid.
Delta Percent (SG2)
Default: Visible; Primary Color: White; Secondary Color: White
Displays Delta values in the numeric information grid.
Primary color is used for positive values and secondary color for negative values.