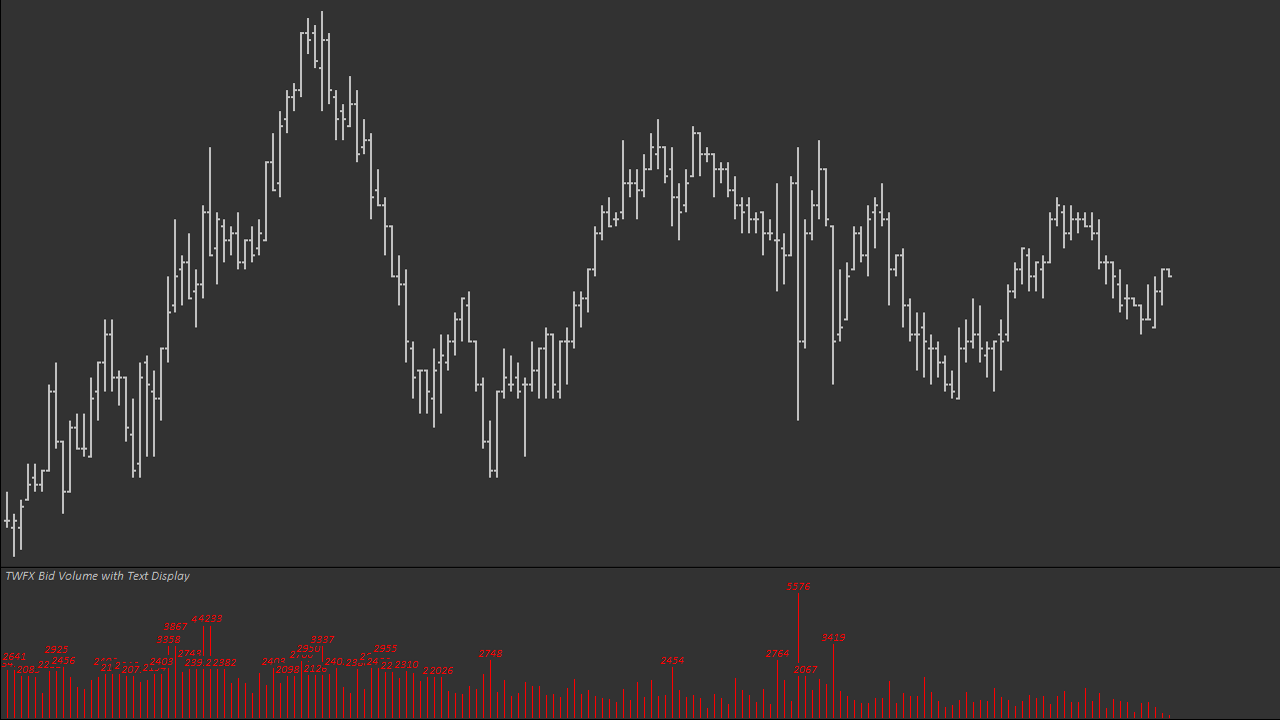
The Bid Volume with Text Display Study displays volume traded at the bid (selling) as a histogram, showing total bid volume per chart bar.
Additionally, the bid volume can be displayed as text above the histogram bars.
Note:
- This study can only be used on charts with a chart data type of ‘Intraday Chart‘
- It is recommended to use ‘Intraday Data Storage Time Unit‘ setting ‘1 Tick’
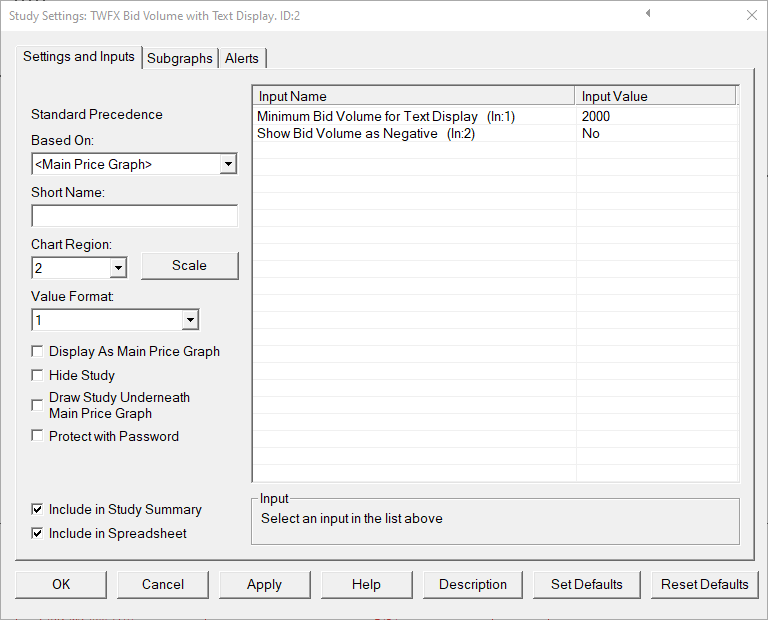
Inputs
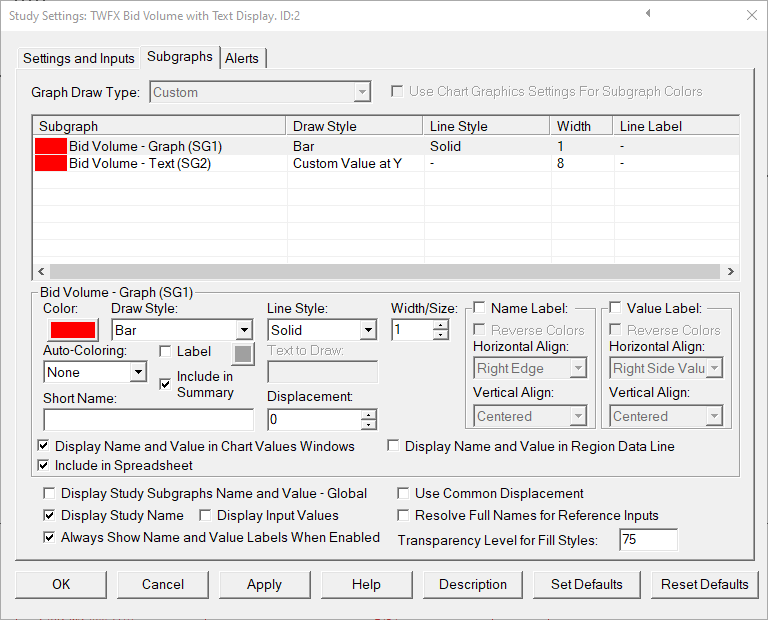
Subgraphs
Bid Volume – Histogram (SG1)
Default: Bar
Displays the total traded bid volume per chart bar
Bid Volume – Text (SG2)
Default: Custom Value at Y
Displays the total traded bid volume per chart bar when the ‘Minimum Bid Volume for Text Display’ threshold is met or exceeded.
Drawstyle options: Custom Value at Y; Custom Value at Y with Border; Transparent Custom Value at Y; Ignore; and Hidden.


