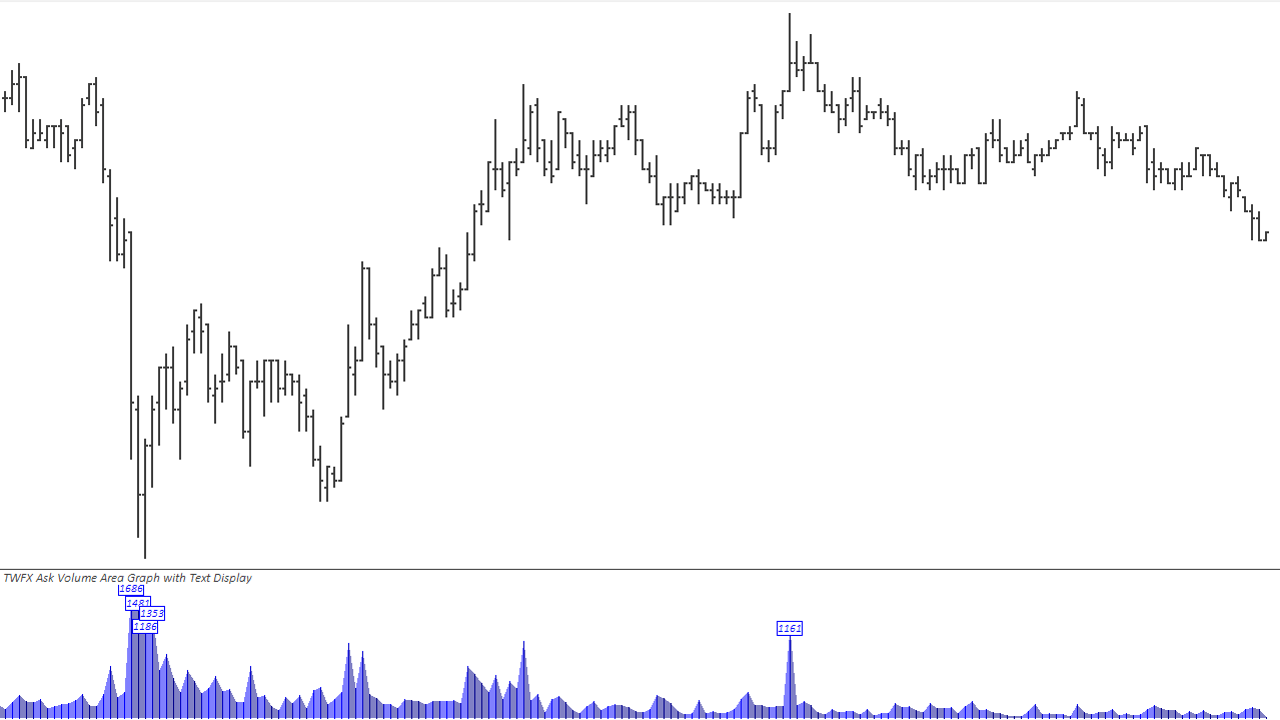
The Ask Volume Area Graph with Text Display Study displays volume traded at the ask (buying) as an area chart, showing total ask volume per chart bar.
Additionally, the ask volume can be displayed as text above the area chart.
Note:
- This study can only be used on charts with a chart data type of ‘Intraday Chart‘
- It is recommended to use ‘Intraday Data Storage Time Unit‘ setting ‘1 Tick’
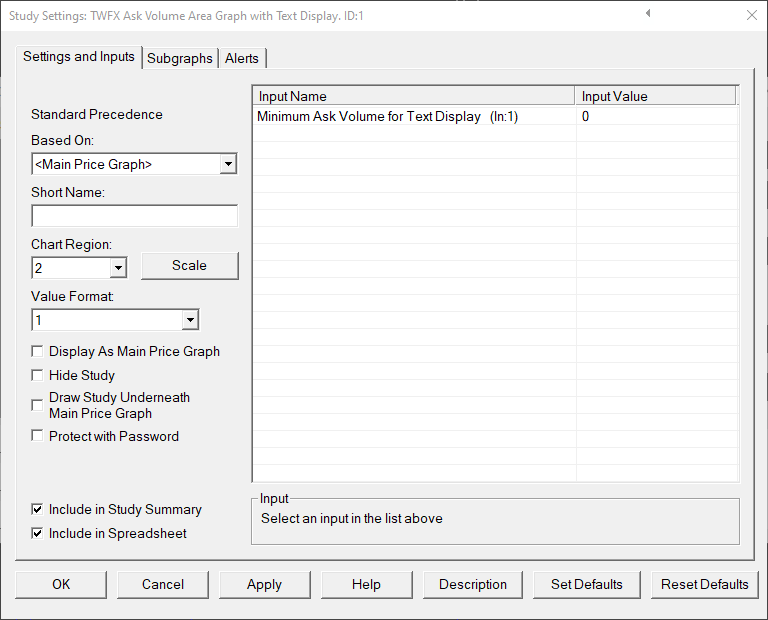
Inputs
Defines the minimum traded ask volume required for text to be displayed above the area chart.
- Min: 0
- Max: 1000000
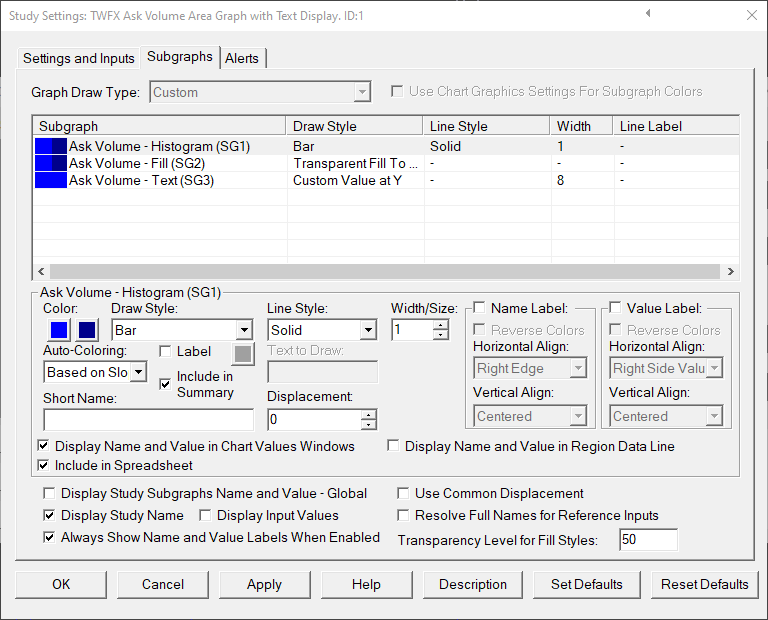
Subgraphs
Ask Volume – Histogram (SG1)
Default: Bar
Displays the total traded ask volume per chart bar
Ask Volume – Fill (SG2)
Default: Transparent Fill to Zero
Displays the total traded ask volume per chart bar
Drawstyle options: Fill to Zero; Transparent Fill to Zero; Fill Rectangle to Zero; and Transparent Fill Rectangle to Zero.
Ask Volume – Text (SG3)
Default: Custom Value at Y
Displays the total traded ask volume per chart bar when the ‘Minimum Ask Volume for Text Display’ threshold is met or exceeded.
Drawstyle options: Custom Value at Y; Custom Value at Y with Border; Transparent Custom Value at Y; Ignore; and Hidden.