The Volume at Price and Orderflow Study monitors the traded volume at the lowest and highest price levels (up to 5) for each chart bar.
The study can be configured to look for specific order flow conditions based on user defined parameters, when the specified conditions are satisfied, subgraph outputs are provided allowing orderflow based alerts to easily be configured.
In addition to the orderflow analysis, the study also exposes the Ask and Bid volume data across the lowest and highest price levels as subgraphs, this allows for further user defined analysis to be performed and/or alerts to be configured.
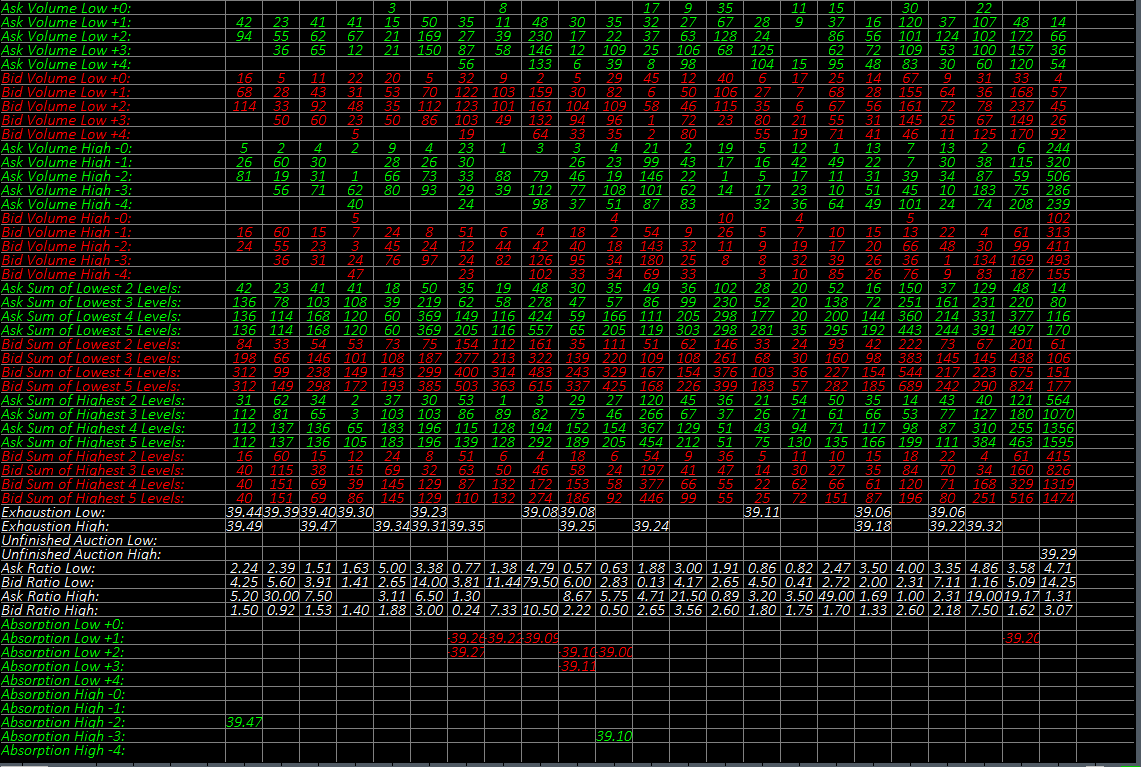
The subgraph outputs from the study are displayed in a numeric information table.
The study is summarised in the following update post – Volume at Price and Orderflow.
Note:
- This study can only be used on charts with a chart data type of ‘Intraday Chart‘
- It is recommended to use ‘Intraday Data Storage Time Unit‘ setting ‘1 Tick’
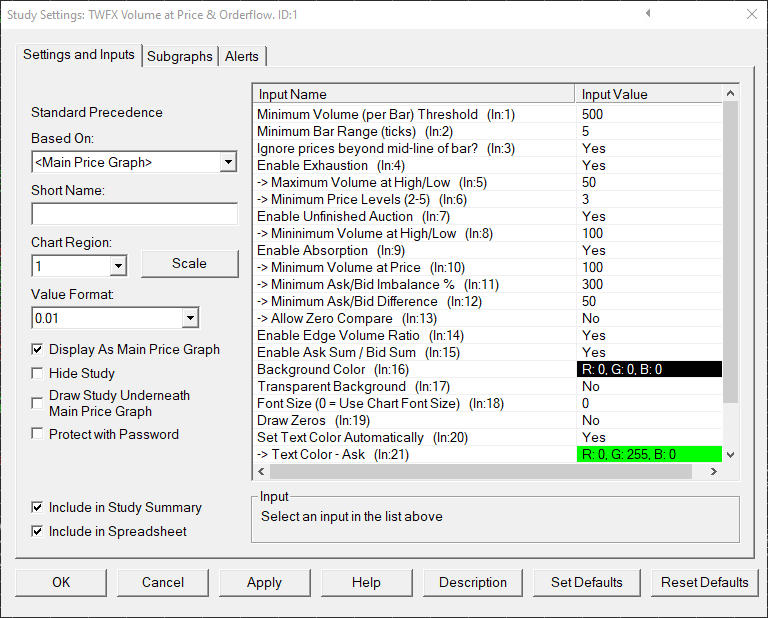
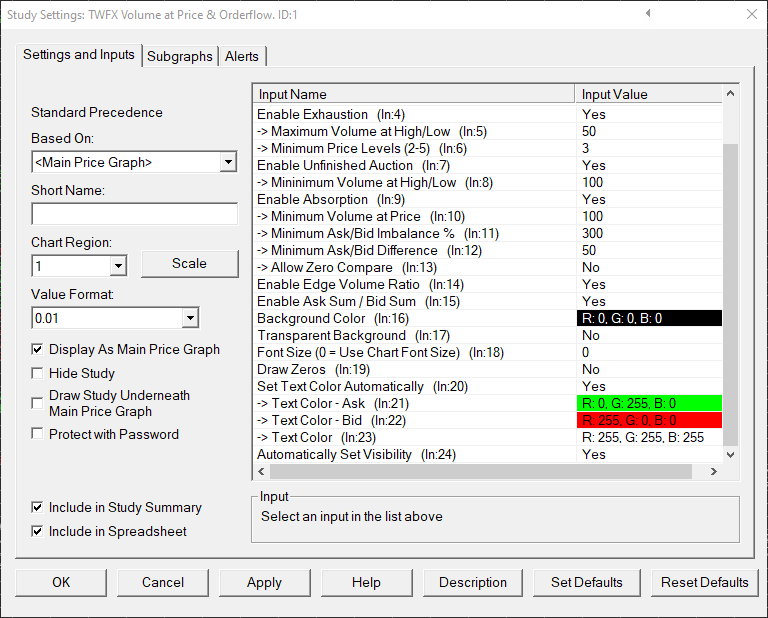
Inputs
Specify the minimum traded volume required before a chart bar is considered for analysis.
- Min: 0
- Max: 1000000
Specify the minimum bar range (Low to High inclusive) required before a chart bar is considered for analysis.
- Min: 2
- Max: 20
Yes:
If the bar range is < 10 ticks, then only the price levels above or below the mid-line price will be considered during analysis of the bar high or bar low respectively.
No:
The first five price levels from high to low, or low to high, are considered during analysis regardless of whether they are above or below the mid-line price.
Enable orderflow exhaustion analysis at high and low of chart bars.
For the the purposes of this study, exhaustion is defined as follows:
1) Ask (Bid) volume at high (low) <= 'Maximum Volume at High/Low';
2) Bid (Ask) volume at high (low) = 0;
3) Ask (Bid) volume decreasing continuously towards high (low) across number of price levels specified by 'Minimum Price Levels (2-5)' setting.
Specify the maximum volume permitted at high/low when checking for exhaustion conditions.
- Min: 1
- Max: 1000000
Specify the minimum number of price levels to evaluate when checking for exhaustion conditions.
- Min: 2
- Max: 5
Enable unfinished auction analysis at the high and low of chart bars.
For the the purposes of this study, unfinished auction is defined as follows:
1) Both ask & bid volumes at high (or low) > 0;
2) Sum of ask & bid volume at high (or low) >= ‘Minimum Volume at High/Low’.
Specify the minimum volume required at high/low before checking for unfinished auction conditions.
- Min: 2
- Max: 1000000
Enable absorption analysis across the five highest and lowest prices of chart bars.
For the purposes of this study, absorption is defined as follows:
1) Sum of ask & bid volume at price level >= ‘Minimum Volume at Price’;
2) Ask (bid) volume at price level as a percentage of bid (ask) volume at price level >= ‘Minimum Ask/Bid Imbalance %’;
3) Absolute difference bewteen ask volume and bid volume at price level >= ‘Minimum Ask/Bid Difference’;
4) If ‘Allow Zero Compare’ is disabled, then both ask volume and bid volume must be > 0.
Specify the minimum volume at price required when checking for absorption conditions.
- Min: 1
- Max: 1000000
Specify the minimum imbalance between ask and bid volume at price.
Ask (bid) volume at price expressed as a percentage of bid (ask) volume at price.
- Min: 101%
- Max: 1000%
Specify the minimum difference between the ask volume at price and the bid volume at price.
- Min: 0
- Max: 1000000
When enabled, 1 is substitued for 0 when checking for absorption conditions.
Enable ratio calculation between edge volumes at the bar high and low.
For the purposes of this study, edge volume is defined as the ratio between the ask or bid volume at highest (lowest) price and the ask or bid volume at next highest (lowest) price.
Enable summing of traded volume across the highest and lowest five price levels for both bid and ask volume.
Specify the background color to be used for the numeric information table.
Background Color is ignored and numeric information table is drawn with transparent background.
Defines the font size (in pixels) used for the numeric information table display.
Note: Use Chart Font Size is not compatible with OpenGL graphics, in this case the font size must be set to the preferred size.
- Min: 0
- Max: 100
If Draw Zeros is enabled, then all cells in the numeric information table that would otherwise be empty will instead be filled with zeros.
When enabled, the subgraph colors for text display will be automatically over-written using the appropriate color from: ‘Text Color – Ask’, ‘Text Color – Bid’ or ‘Text Color’.
Specify the color to be used for Ask Text values when ‘Set Text Color Automatically’ is enabled.
Specify the color to be used for Bid Text values when ‘Set Text Color Automatically’ is enabled.
Specify the color to be used for Text values when ‘Set Text Color Automatically’ is enabled.
When enabled, subgraph visibility in the numeric information table is set automatically based on whether the feature associated with the subgraph is enabled.
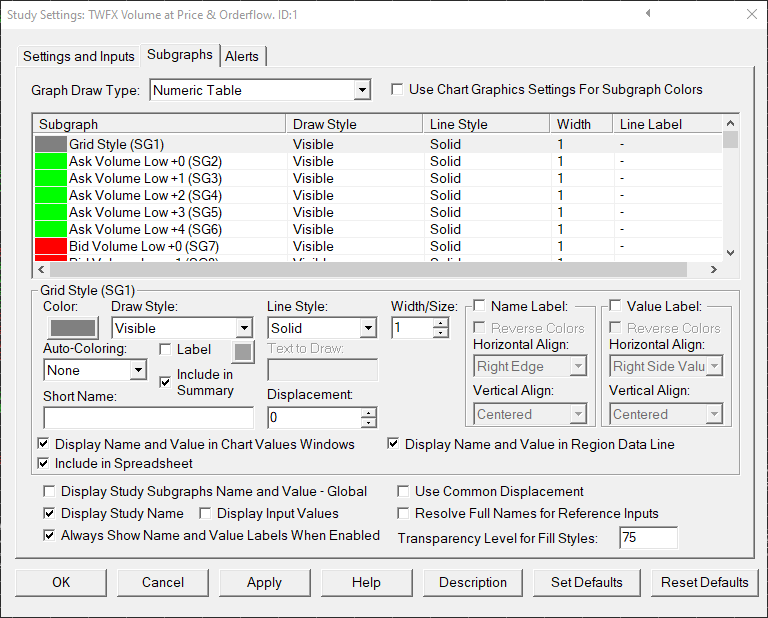
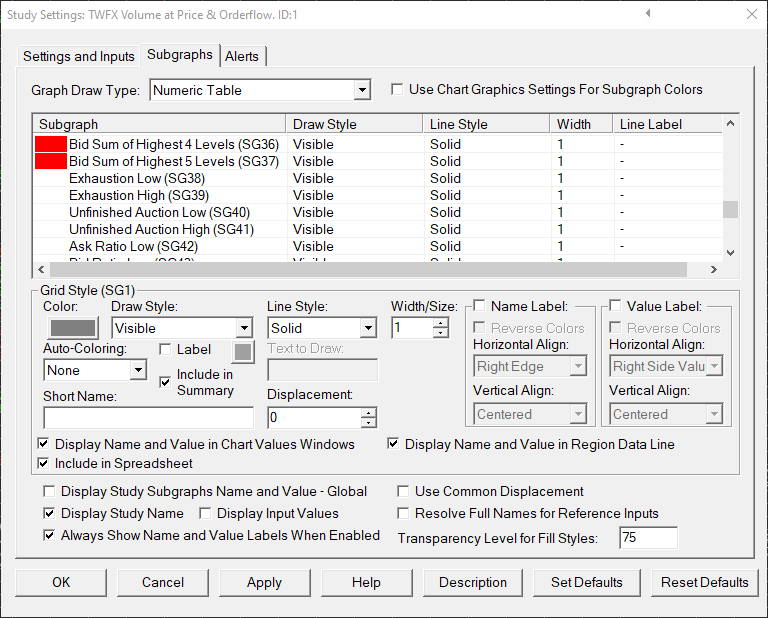
Subgraphs
Default: Visible
Defines the visibility, color, linestyle and line width used for the grid of the numeric information table.
Ask Volume Low +0 (SG2)
Ask Volume Low +1 (SG3)
Ask Volume Low +2 (SG4)
Ask Volume Low +3 (SG5)
Ask Volume Low +4 (SG6)
Default: Visible
Defines the visibility and color used for Ask Volume Low subgraphs.
Displays the ask volume at price for the lowest five price levels.
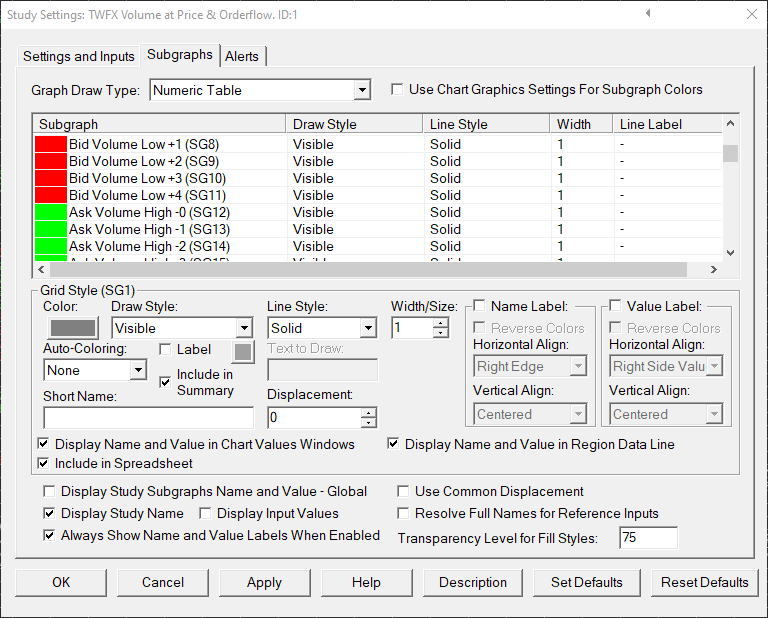
Bid Volume Low +0 (SG7)
Bid Volume Low +1 (SG8)
Bid Volume Low +2 (SG9)
Bid Volume Low +3 (SG10)
Bid Volume Low +4 (SG11)
Default: Visible
Defines the visibility and color used for Bid Volume Low subgraphs.
Displays the bid volume at price for the lowest five price levels.
Ask Volume High -0 (SG12)
Ask Volume High -1 (SG13)
Ask Volume High -2 (SG14)
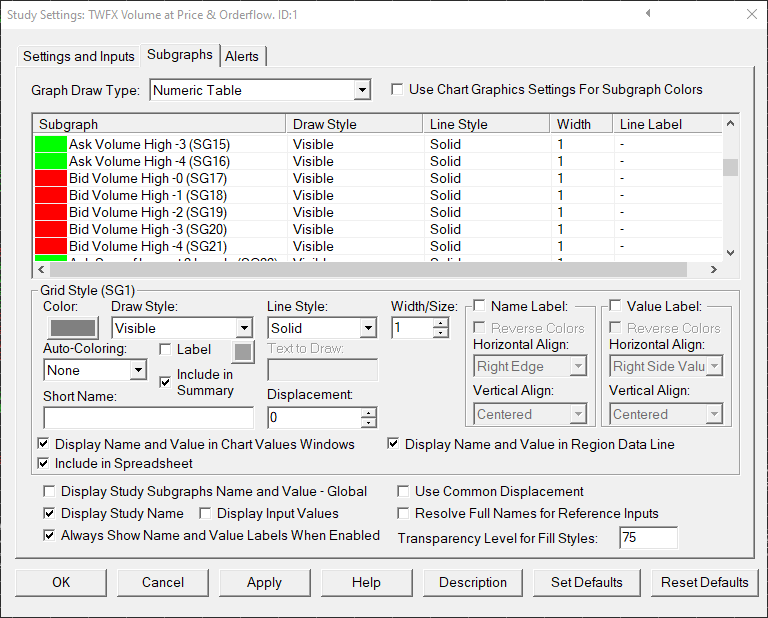
Ask Volume High -3 (SG15)
Ask Volume High -4 (SG16)
Default: Visible
Defines the visibility and color used for Ask Volume High subgraphs.
Displays the ask volume at price for the highest five price levels.
Bid Volume High -0 (SG17)
Bid Volume High -1 (SG18)
Bid Volume High -2 (SG19)
Bid Volume High -3 (SG20)
Bid Volume High -4 (SG21)
Default: Visible
Defines the visibility and color used for Bid Volume High subgraphs.
Displays the bid volume at price for the highest five price levels.
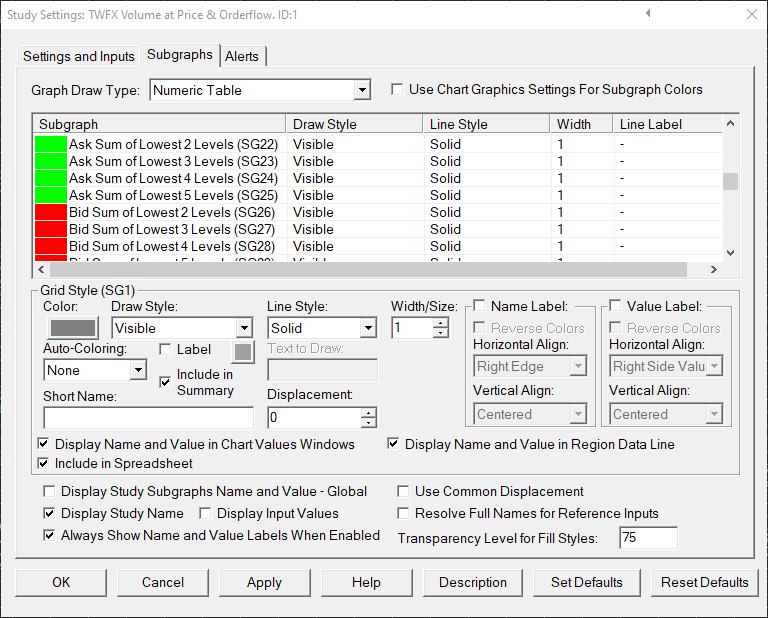
Ask Sum of Lowest 2 Levels (SG22)
Ask Sum of Lowest 3 Levels (SG23)
Ask Sum of Lowest 4 Levels (SG24)
Ask Sum of Lowest 5 Levels (SG25)
Default: Visible
Defines the visibility and color used for Ask Sum of Lowest subgraphs.
Displays the sum of the ask volume at price for the specified number of price levels at the low of the chart bar.
Bid Sum of Lowest 2 Levels (SG26)
Bid Sum of Lowest 3 Levels (SG27)
Bid Sum of Lowest 4 Levels (SG28)
Bid Sum of Lowest 5 Levels (SG29)
Default: Visible
Defines the visibility and color used for Bid Sum of Lowest subgraphs.
Displays the sum of the bid volume at price for the specified number of price levels at the low of the chart bar.
Ask Sum of Highest 2 Levels (SG30)
Ask Sum of Highest 3 Levels (SG31)
Ask Sum of Highest 4 Levels (SG32)
Ask Sum of Highest 5 Levels (SG33)
Default: Visible
Defines the visibility and color used for Ask Sum of Highest subgraphs.
Displays the sum of the ask volume at price for the specified number of price levels at the high of the chart bar.
Bid Sum of Highest 2 Levels (SG34)
Bid Sum of Highest 3 Levels (SG35)
Bid Sum of Highest 4 Levels (SG36)
Bid Sum of Highest 5 Levels (SG37)
Default: Visible
Defines the visibility and color used for Bid Sum of Highest subgraphs.
Displays the sum of the bid volume at price for the specified number of price levels at the high of the chart bar.
Exhaustion Low (SG38)
Displays the low price of the chart bar if the specified exhaustion conditions have been met.
Exhaustion High (SG39)
Displays the high price of the chart bar if the specified exhaustion conditions have been met.
Unfinished Auction Low (SG40)
Displays the low price of the chart bar if the specified unfinished auction conditions have been met.
Unfinished Auction High (SG41)
Displays the high price of the chart bar if the specified unfinished auction conditions have been met.
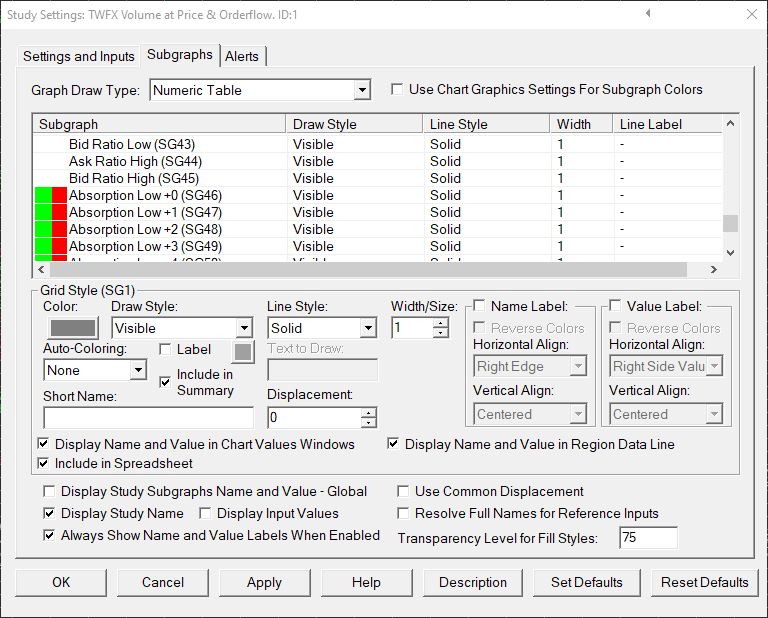
Ask Ratio Low (SG42)
Displays the ratio between the ask volume at the lowest and next lowest price levels.
Bid Ratio Low (SG43)
Displays the ratio between the bid volume at the lowest and next lowest price levels.
Ask Ratio High (SG44)
Displays the ratio between the ask volume at the highest and next highest price levels.
Displays the ratio between the bid volume at the highest and next highest price levels.
Absorption Low +1 (SG47)
Absorption Low +2 (SG48)
Absorption Low +3 (SG49)
Absorption Low +4 (SG50)
Displays the price(s) at which the specified absorption conditions have been met.
Note: To differentiate between ask and bid volume absorption –
– Ask dominant absorption causes the price level to be shown as a positive number
– Bid dominant absorption causes the price level to be shown as a negative number
Absorption High -1 (SG52)
Absorption High -2 (SG53)
Absorption High -3 (SG54)
Absorption High -4 (SG55)
Displays the price(s) at which the specified absorption conditions have been met.
Note: To differentiate between ask and bid volume absorption –
– Ask dominant absorption causes the price level to be shown as a positive number
– Bid dominant absorption causes the price level to be shown as a negative number