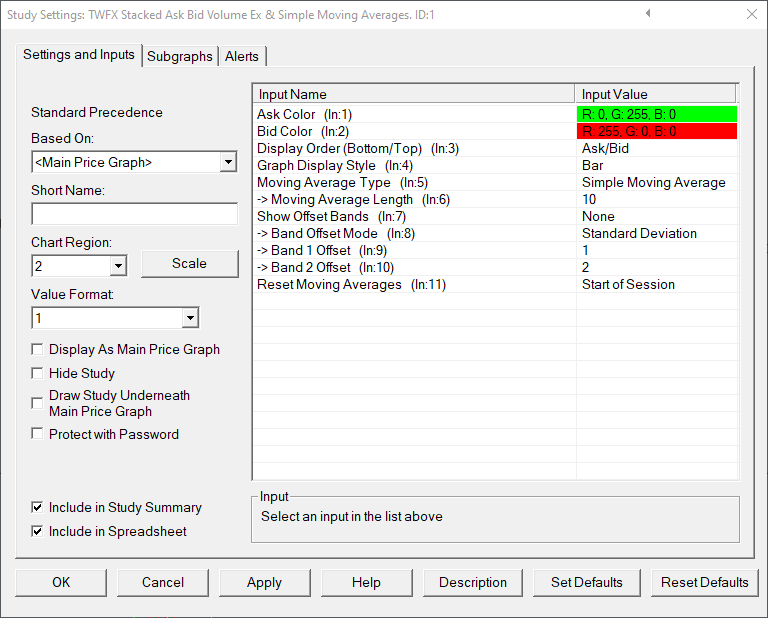
The Stacked Ask Bid Volume Study Ex is an extended version of Stacked Ask Bid Volume study, and includes moving averages with standard deviation and percentage bands. The study output is displayed using upto 18 subgraphs, depending on the configuration used.
The study is summarised in the following update post – Stacked Ask Bid Volume Ex.
Note:
- This study can only be used on charts with a chart data type of ‘Intraday Chart‘
- It is recommended to use ‘Intraday Data Storage Time Unit‘ setting ‘1 Tick’
Inputs
Defines the color used for bid volume display.
Defines the order in which the Ask and Bid volume subgraphs are displayed.
- Ask/Bid: Ask volume subgraph is drawn below Bid volume subgraph.
- Bid/Ask: Bid volume subgraph is drawn below Ask volume subgraph.
Defines how the subgraphs are displayed using predefined drawstyles.
Note: The height of the stacked ask and bid volumes represents the total volume.
- Bar: Ask and Bid volumes are displayed as bars stacked one on top of the other.
- Line: Ask and Bid volumes are displayed as lines stacked one on top of the other.
- Area: Ask and Bid volumes are displayed as filled areas stacked one on top of the other.
Select the moving average type that is applied to the volume data.
Details of the moving average types can be found in the documentation on the Sierra Chart website – Moving Average Type.
Define the moving average length.
- Min: 3
- Max: 100000
Define if (and how many) moving average offset (percentage or standard deviation) bands are displayed, choose from None, 1 or 2 bands.
Select the moving average band offset mode.
- Standard Deviation: Bands are offset from moving average by specified standard deviation of volume values.
- Percentage: Bands are offset from moving average by specified specified percentage of volume moving average values.
Specify the band 1 offset amount.
- Min: 0.01
- Max: 1000
Specify the band 2 offset amount.
- Min: 0.01
- Max: 1000
Specify when/if moving averages and theire associated bands are reset.
- No: Moving averages are continuously calculated and never reset.
- Start of Trading Day: Moving averages are reset at the beginning of each trading day.
- Start of Session: Moving averages are reset at the beginning of each trading session.
Subgraphs
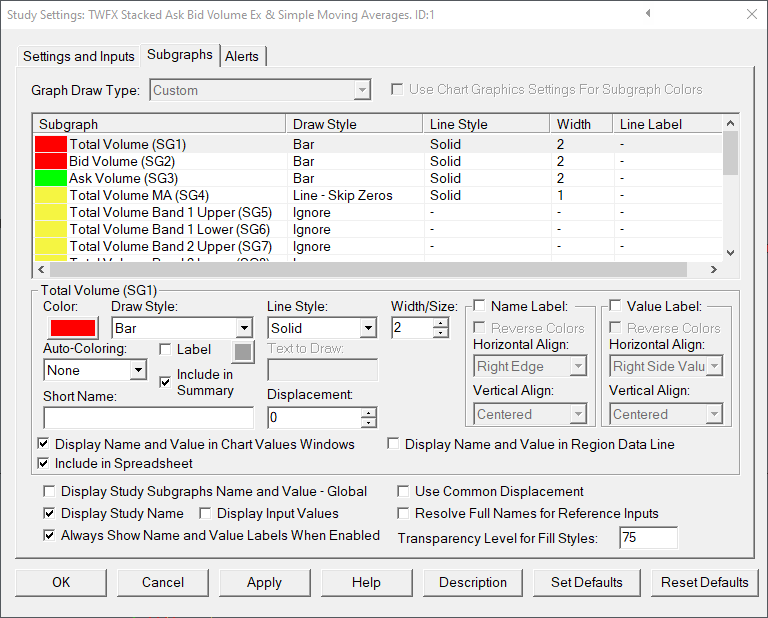
Displays the total traded volume per chart bar.
Displays the Ask or Bid traded volume per chart bar, depending on the input setting ‘Display Order (Bottom/Top)’
If ‘Display Order (Bottom/Top)’ is set to Ask/Bid, subgraph 2 displays the Bid volume.
If ‘Display Order (Bottom/Top)’ is set to Bid/Ask, subgraph 2 displays the Ask volume.
Displays the Ask or Bid traded volume per chart bar, depending on the input setting ‘Display Order (Bottom/Top)’
If ‘Display Order (Bottom/Top)’ is set to Ask/Bid, subgraph 3 displays the Ask volume.
If ‘Display Order (Bottom/Top)’ is set to Bid/Ask, subgraph 3 displays the Bid volume.
Displays the specified Moving Average of the total volume
Displays total volume – offset band 1 upper
Displays total volume – offset band 1 lower
Displays total volume – offset band 2 upper
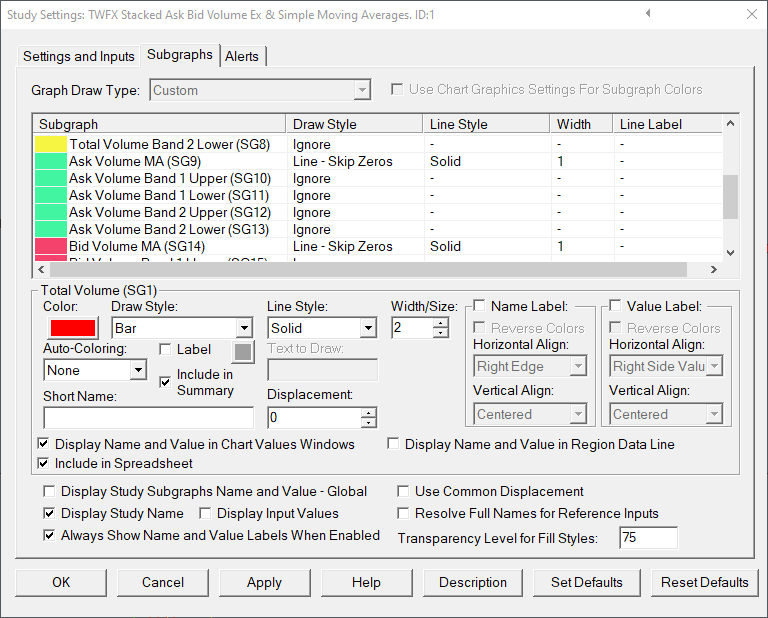
Displays total volume – offset band 2 lower
Displays the specified Moving Average of the total volume
Displays ask volume – offset band 1 upper
Displays ask volume – offset band 1 lower
Default: Ignore
Displays ask volume – offset band 2 upper
Default: Ignore
Displays ask volume – offset band 2 lower
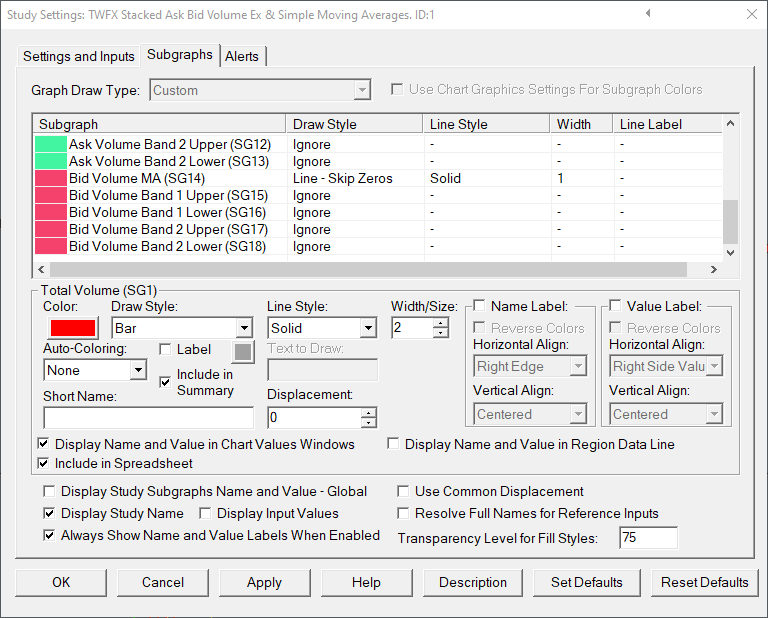
Displays the specified Moving Average of the total volume
Displays bid volume – offset band 1 upper
Displays bid volume – offset band 1 lower
Displays bid volume – offset band 2 upper
Displays bid volume – offset band 2 lower


