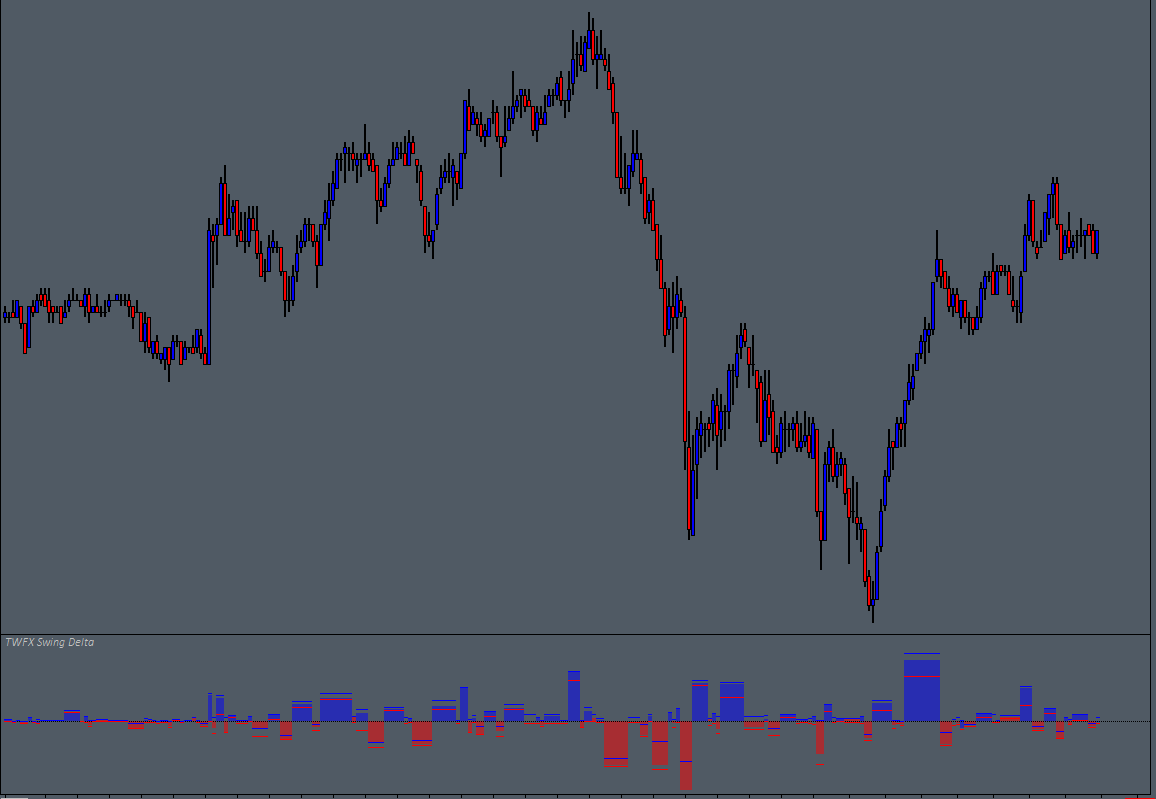
The Swing Delta Study tracks and displays Ask vs. Bid Delta for each minor price rotation. Minimum and maximum delta, and divergent delta can also optionally be displayed by the study.
The study is summarised in the following update post – Swing Delta.
Note:
- This study can only be used on charts with a chart data type of ‘Intraday Chart‘
- It is recommended to use ‘Intraday Data Storage Time Unit‘ setting ‘1 Tick’
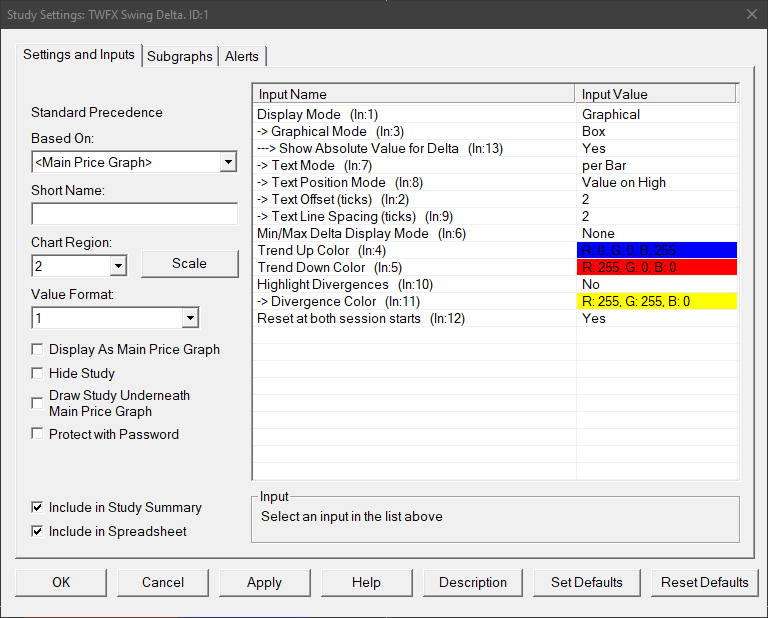
Inputs
Defines the study display mode.
- Graphical: Swing delta subgraphs are displayed as histograms, lines and boxes.
- Text: Swing delta subgraphs are displayed as text, useful for displaying delta values on the main price chart.
Defines the mode used when displaying the swing delta subgraphs graphically.
- Box: Delta is displayed using boxes to represent each price rotation, the height being the final delta at the end of the rotation.
Maximum and minimum delta (when used) are displayed as lines. - Histogram: Delta is displayed using individual bars for each chart bar period within each price rotation.
Maximum and minimum delta (when used) are displayed as lines.
Show Absolute Value for Delta (In:13)
Displays delta as absolute value, allowing easier comparision between positive and negative delta
swings.
Note: Min/Max Delta Display Mode is automatically set to ‘none’ when absolute delta is enabled.
Defines when delta text output is displayed on the chart.
- per Bar: Delta text output is displayed for each bar in the chart.
- per Swing: Delta text output is displayed only at the end of each price rotation.
Specify the delta text display position.
- Value on High: Delta output is displayed as text, above the high of the chart bar, offset by the specified amount.
- Value on Low: Delta output is displayed as text, below the low of the chart bar, offset by the specified amount.
- Value on High/Low: Delta output is displayed as text, offset by the specified amount, either above the high of chart bars where Close >= Open, or below the low of chart bars where Close < Open.
Specify the delta text display offset, from high/low measured in ticks.
- Min: 0
- Max: 50
Specify the spacing between each line of delta text output, measured in ticks.
- Min: 2
- Max: 20
Defines the display mode for minimum and maximum delta output.
- per Bar: Delta minimum and maximum output is displayed for each bar in the chart.
- per Swing: Delta minimum and maximum output is displayed only at the end of each price rotation.
- None: Neither minimum nor maximum delta is displayed
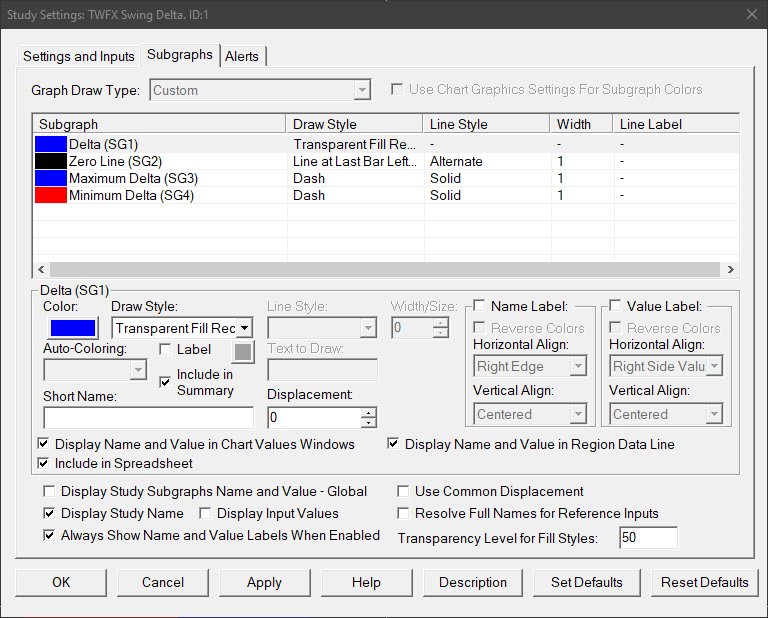
Subgraphs
Drawstyle automatically set by study depending on configuration
Displays the accumulated swing delta per bar or per swing
Default: Line Extend to Edge
Displays horizontal axis at 0, graphical mode only
Displays the maximum accumulated per swing
Displays the minimum accumulated per swing