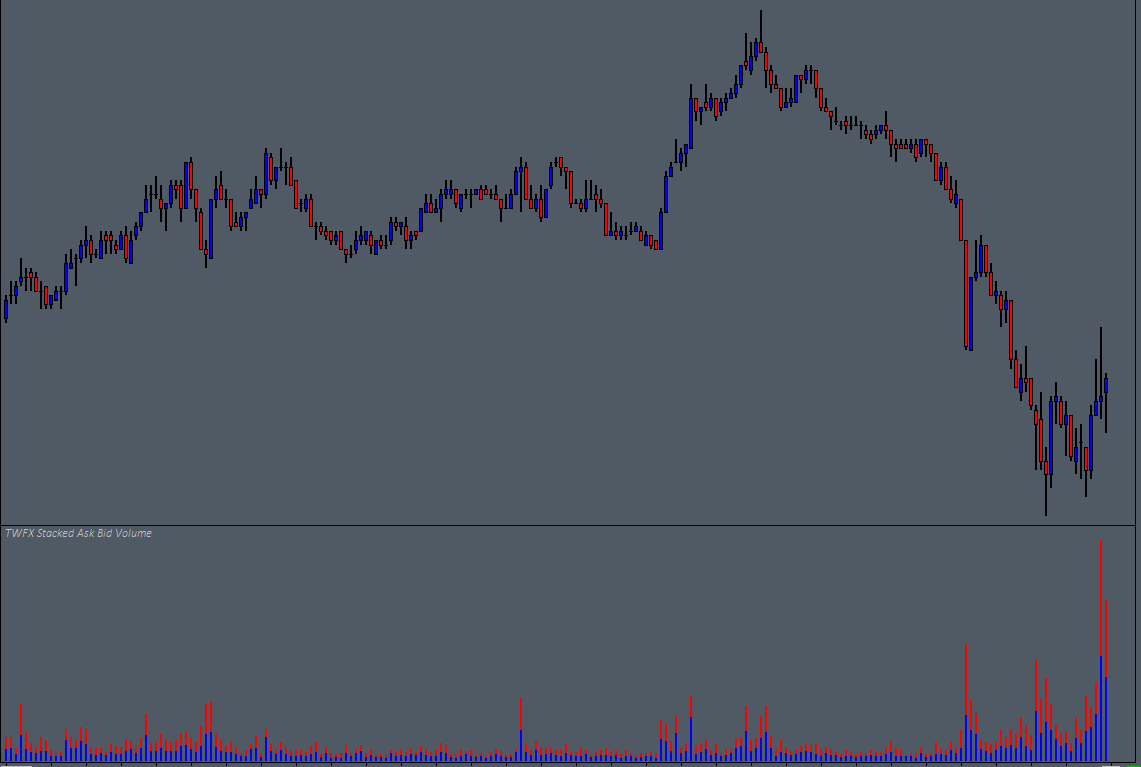
The Stacked Ask Bid Volume Study displays traded volume as a histogram, showing total volume per bar divided into the constituent Ask & Bid components.
The study is summarised in the following update post – Stacked Ask Bid Volume.
Note:
- This study can only be used on charts with a chart data type of ‘Intraday Chart‘
- It is recommended to use ‘Intraday Data Storage Time Unit‘ setting ‘1 Tick’
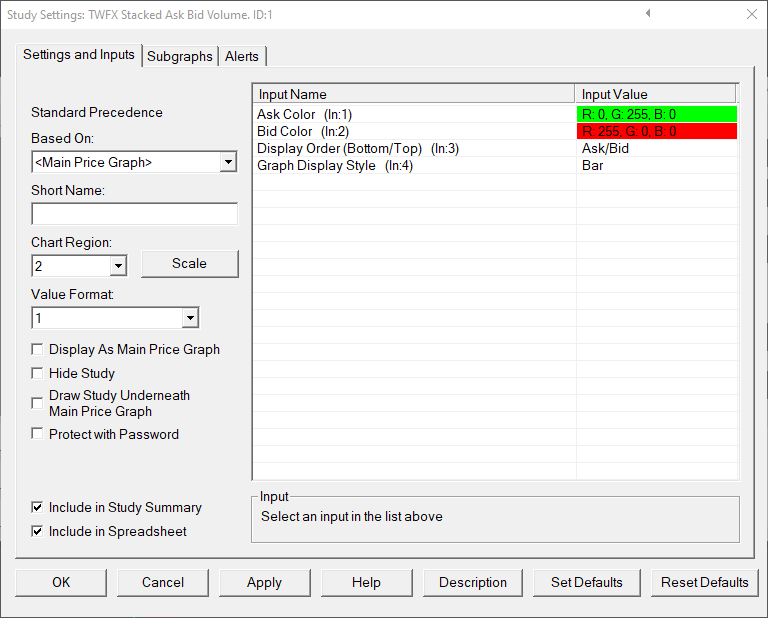
Inputs
Defines the order in which the Ask and Bid volume subgraphs are displayed.
- Ask/Bid: Ask volume subgraph is drawn below Bid volume subgraph.
- Bid/Ask: Bid volume subgraph is drawn below Ask volume subgraph.
Defines how the subgraphs are displayed using predefined drawstyles.
Note: The height of the stacked ask and bid volumes represents the total volume.
- Bar: Ask and Bid volumes are displayed as bars stacked one on top of the other.
- Line: Ask and Bid volumes are displayed as lines stacked one on top of the other.
- Area: Ask and Bid volumes are displayed as filled areas stacked one on top of the other.
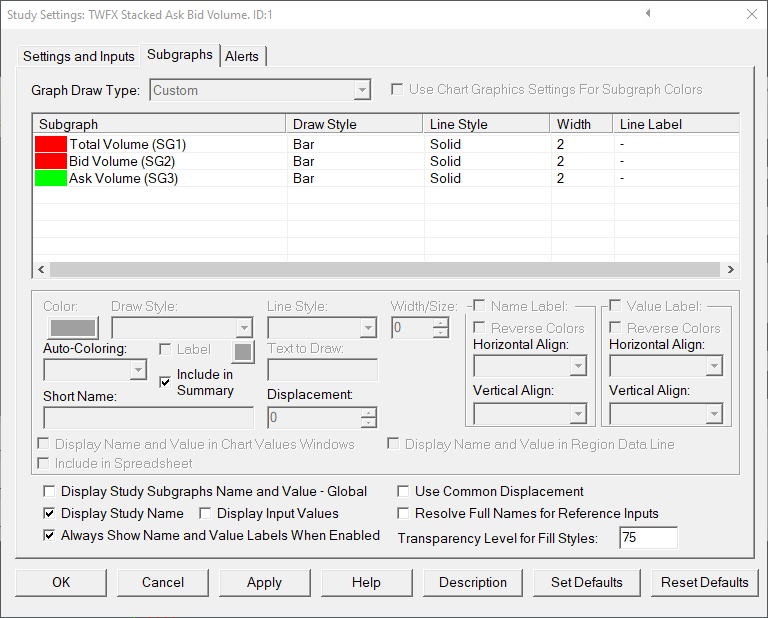
Subgraphs
Default: Bar
Displays the total traded volume per chart bar.
Bid Volume (Ask Volume) (SG2)
Default: Bar
Displays the Ask or Bid traded volume per chart bar, depending on the input setting ‘Display Order (Bottom/Top)’
If ‘Display Order (Bottom/Top)’ is set to Ask/Bid, subgraph 2 displays the Bid volume.
If ‘Display Order (Bottom/Top)’ is set to Bid/Ask, subgraph 2 displays the Ask volume.
Default: Bar
Displays the Ask or Bid traded volume per chart bar, depending on the input setting ‘Display Order (Bottom/Top)’
If ‘Display Order (Bottom/Top)’ is set to Ask/Bid, subgraph 3 displays the Ask volume.
If ‘Display Order (Bottom/Top)’ is set to Bid/Ask, subgraph 3 displays the Bid volume.