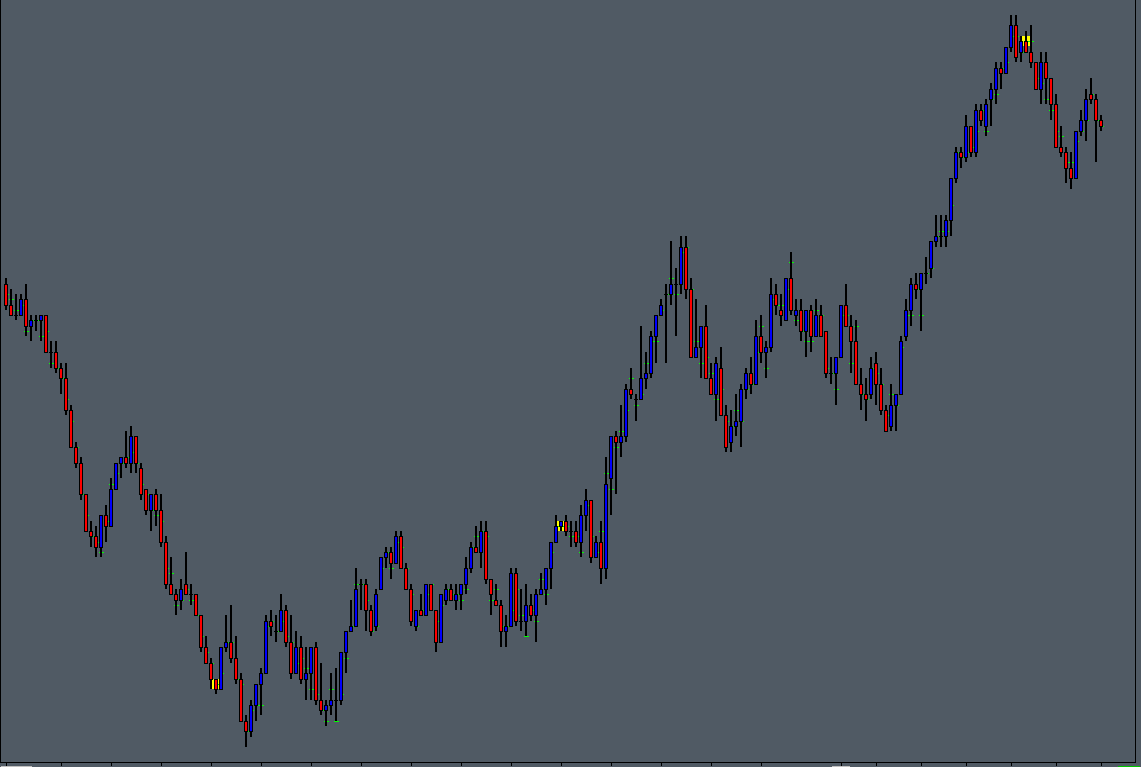
The POC per Bar Study tracks the volume at price data for each chart bar and, optionally, highlights the Volume Point of Control for each price bar, and/or displays additonal highlighting when the specified point of control volume at price threshold is exceeded.
The study is summarised in the following update post – POC per Bar.
Note:
- This study can only be used on charts with a chart data type of ‘Intraday Chart‘
- It is recommended to use ‘Intraday Data Storage Time Unit‘ setting ‘1 Tick’
Inputs
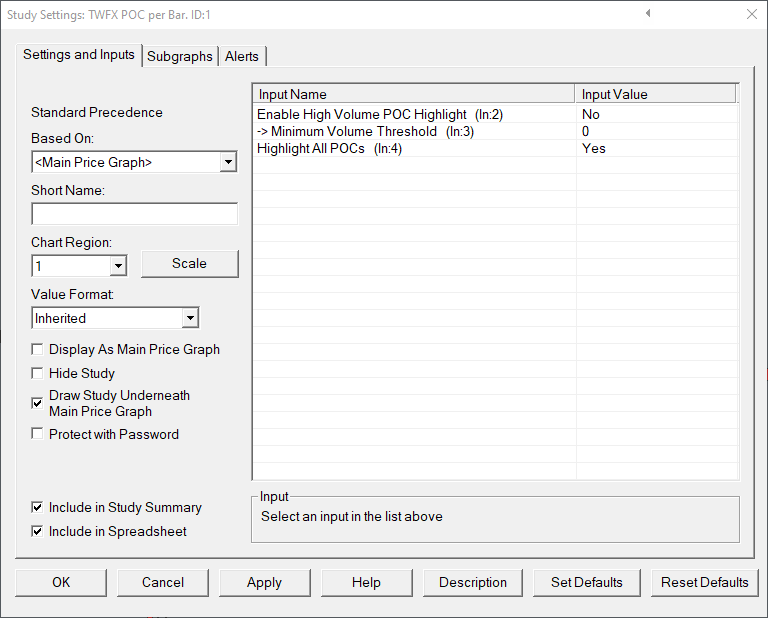
Enable High Volume POC Highlight (In:2)
When enabled, a marker is drawn at every chart bar POC where the volume exceeds the ‘Minimum Volume Threshold’.
Minimum Volume Threshold (In:3)
Defines the minimum volume trigger for High Volume POC highlight.
- Min: 0
- Max: 1000000
Highlight All POCs (In:4)
When enabled, a marker is drawn at every chart bar POC regardless of the volume.
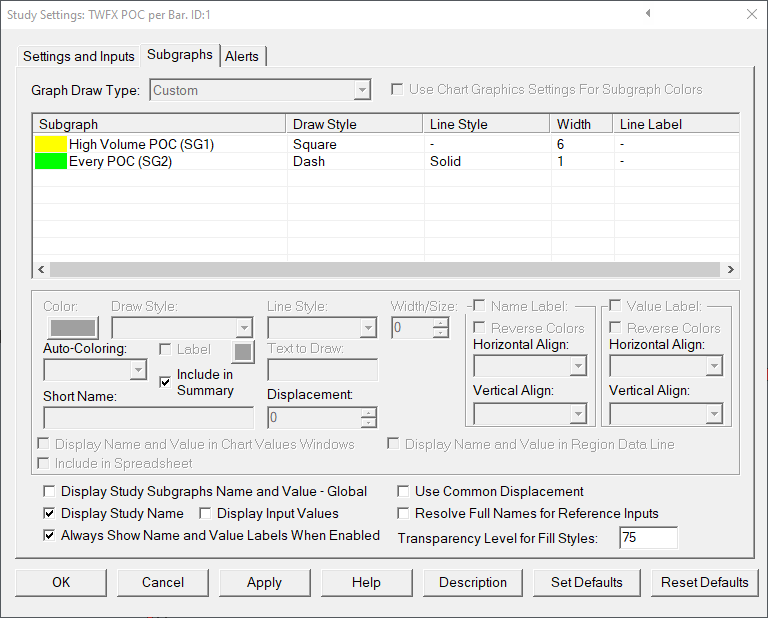
Subgraphs
High Volume POC (SG1)
Default: Square
Displays VPOC marker for all chart bar where POC volume exceeds specified threshold.
Every POC (SG2)
Default: Dash
Displays VPOC marker for all chart bars.