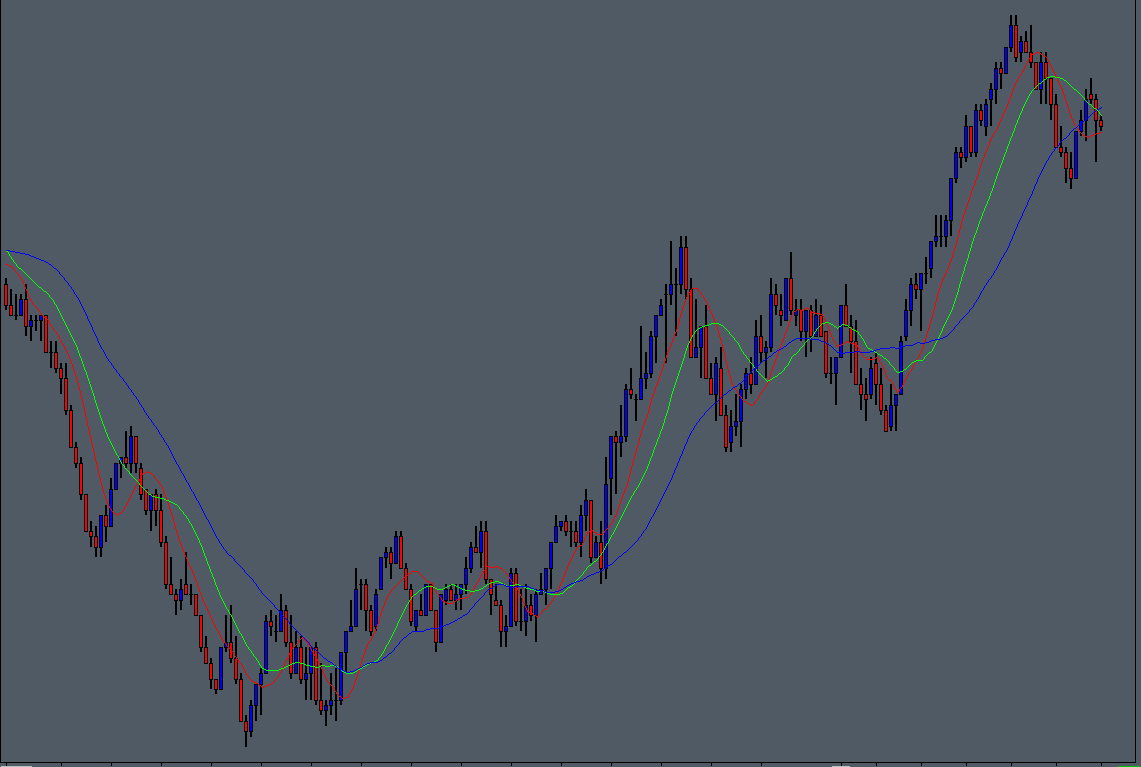
The POC per Bar Study tracks the volume at price data for each chart bar and highlights the Volume Point of Control for each price bar, in addition, the trends in POC price migration can be tracked using the moving average display outout options. The study output is displayed using upto 4 subgraphs, depending on how the study is configured.
The study is summarised in the following update post – POC per Bar Moving Average.
Note:
- This study can only be used on charts with a chart data type of ‘Intraday Chart‘
- It is recommended to use ‘Intraday Data Storage Time Unit‘ setting ‘1 Tick’
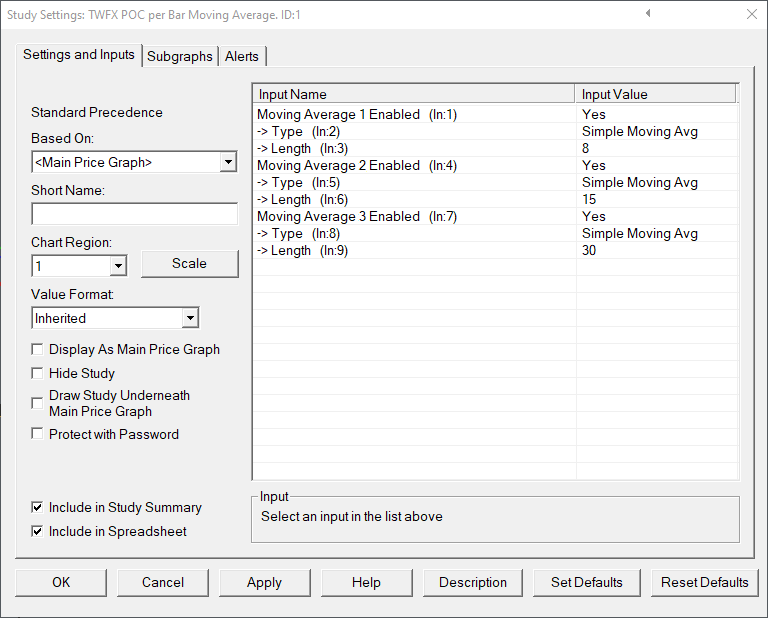
Inputs
Type (In:2)
Select the type of the first moving average applied to the POC price data.
Details of the moving average types can be found in the documentation on the Sierra Chart website – Moving Average Type.
Length (In:3)
Define the length of the first moving average.
- Min: 3
- Max: 100000
Type (In:5)
Select the type of the second moving average applied to the POC price data.
Length (In:6)
Define the length of the second moving average.
- Min: 3
- Max: 100000
Type (In:8)
Select the type of the third moving average type applied to the POC price data.
Length (In:9)
Define the length of the third moving average.
- Min: 3
- Max: 100000
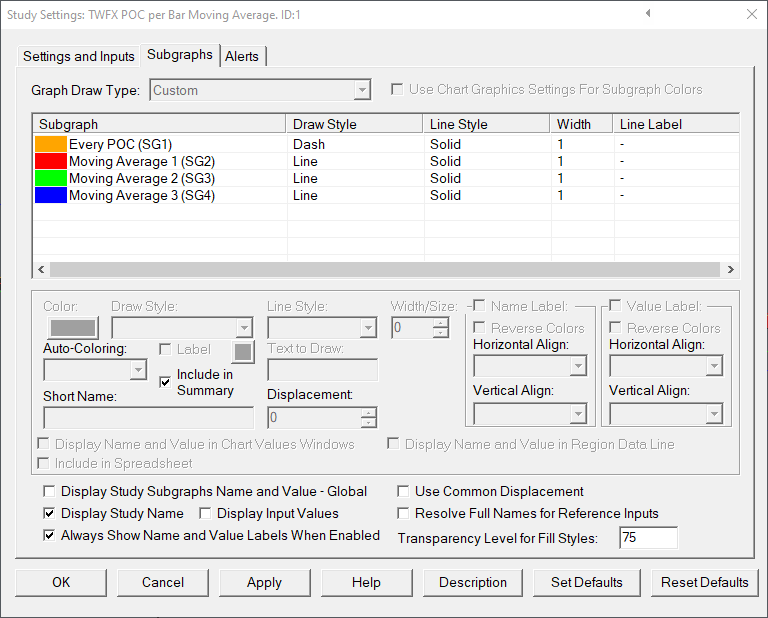
Subgraphs
Default: Dash
Displays VPOC marker for all chart bars.
Moving Average 1 (SG2)
Default: Line
Displays the first Moving Average of VPOC price
Moving Average 2 (SG3)
Default: Line
Displays the second Moving Average of VPOC price
Moving Average 3 (SG4)
Default: Line
Displays the third Moving Average of VPOC price