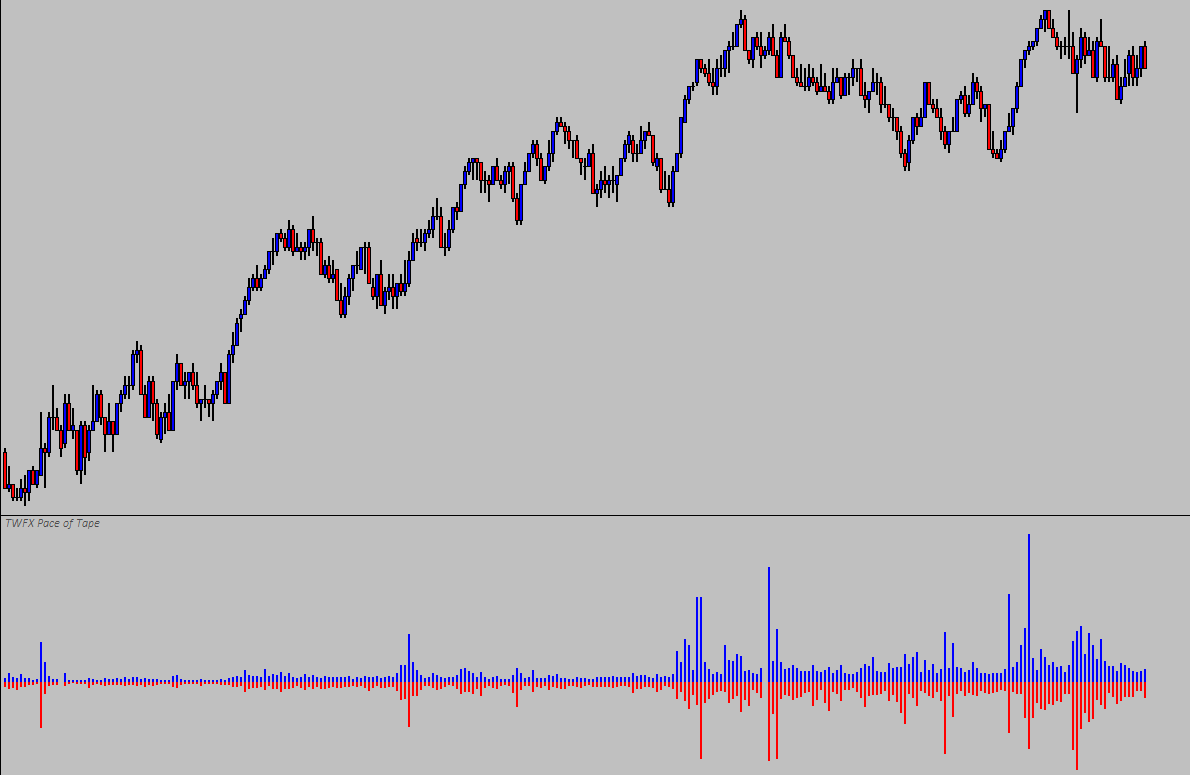
The Pace of Tape study tracks the rate at which orders are being filled and can be used to identify when trading is being conducted with greater urgency. The values recorded by the study are displayed using upto 3 subgraphs, depending on the configuration.
The study is summarised in the following update post – Pace of Tape.
Note:
- This study can only be used on charts with a chart data type of ‘Intraday Chart‘
- It is recommended to use ‘Intraday Data Storage Time Unit‘ setting ‘1 Tick’
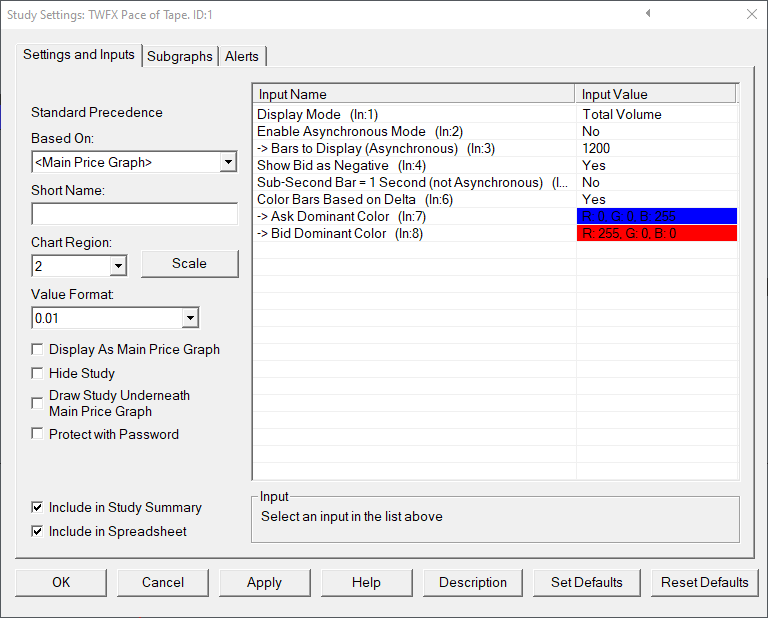
Inputs
Specify how the pace of tape study output is displayed.
- Ask, Bid & Total Volume: Displays separate subgraph output for each of ask, bid and total volume per second.
- Ask & Bid Volume: Displays separate subgraph output for ask and bid volume per second.
- Total Volume: Display only the total volume per second subgraph.
- Highest Ask or Bid: Displays a single subgraph showing the greater of ask volume per second and bid volume per second.
- Ask: Displays only the ask volume per second subgraph.
- Bid: Displays only the bid volume per second subgraph.
- Delta: Displays a single subgraph showing the difference (delta) between the ask volume per second and the bid volume per second.
When asynchronous mode is enabled, the study subgraph output time frame is independent of the underlying chart and is displayed with a bar duration of 1 second.
The study output in asynchronous mode is actual volume per second, whereas when in synchronous mode the study output is the calculated average volume per second.
- Min: 1
- Max: 10000
When show bid as negative is enabled, bid volume pace is displayed as a negative number, whilst ask (and total) volume pace is displayed as a positive number.
This allows simple visual comparison between ask and bid volume pace values, when using drawstyles that may overlap, such as ‘Bar’.
When enabled, any chart bar with a duration of less than 1 second will be considered to have a duration of 1 second for the pace of tape calculation.
Applies to synchronous mode only, and is intended to be used in conjunction with non-time based charts bars.
Color Bars Based on Delta (In:6)
Applies only when ‘Display Mode’ is set to ‘Total Volume’.
When enabled, the study subgraph output at each chart bar index is colored based on the dominant side:
- Ask > Bid: ‘Ask Dominant Color’ is used
- Bid > Ask: ‘Bid Dominant Color’ is used
- Ask = Bid: Volume Per Second subgraph color is used
Ask Dominant Color (In:7)
Defines the color used for ask dominant bars when using ‘Color Bars Based on Delta’.
Bid Dominant Color (In:8)
Defines the color used for bid dominant bars when using ‘Color Bars Based on Delta’.
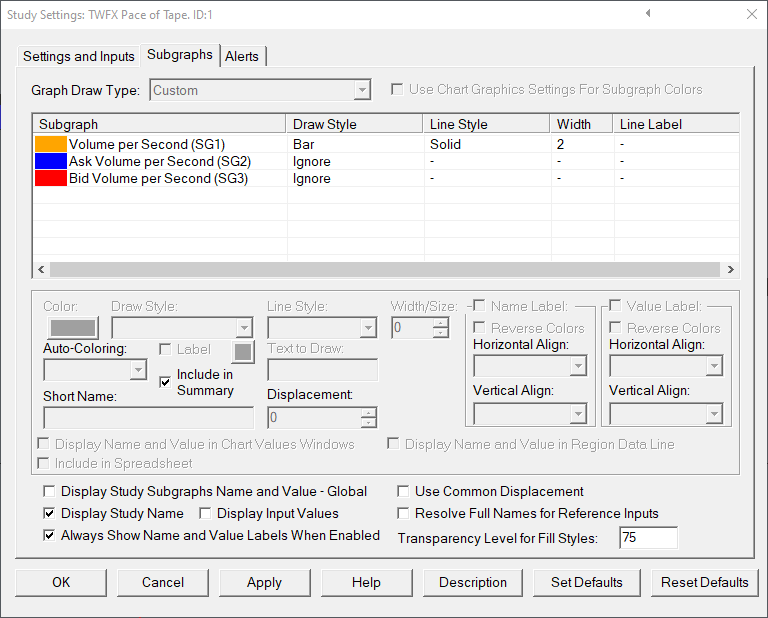
Subgraphs
Default: Line
Displays the total volume traded per second, actual or average, depending on the study aysnchronous mode setting.
Ask Volume per Second (SG2)
Default: Line
Displays the ask volume traded per second, actual or average, depending on the study aysnchronous mode setting.
Default: Line
Displays the bid volume traded per second, actual or average, depending on the study aysnchronous mode setting.