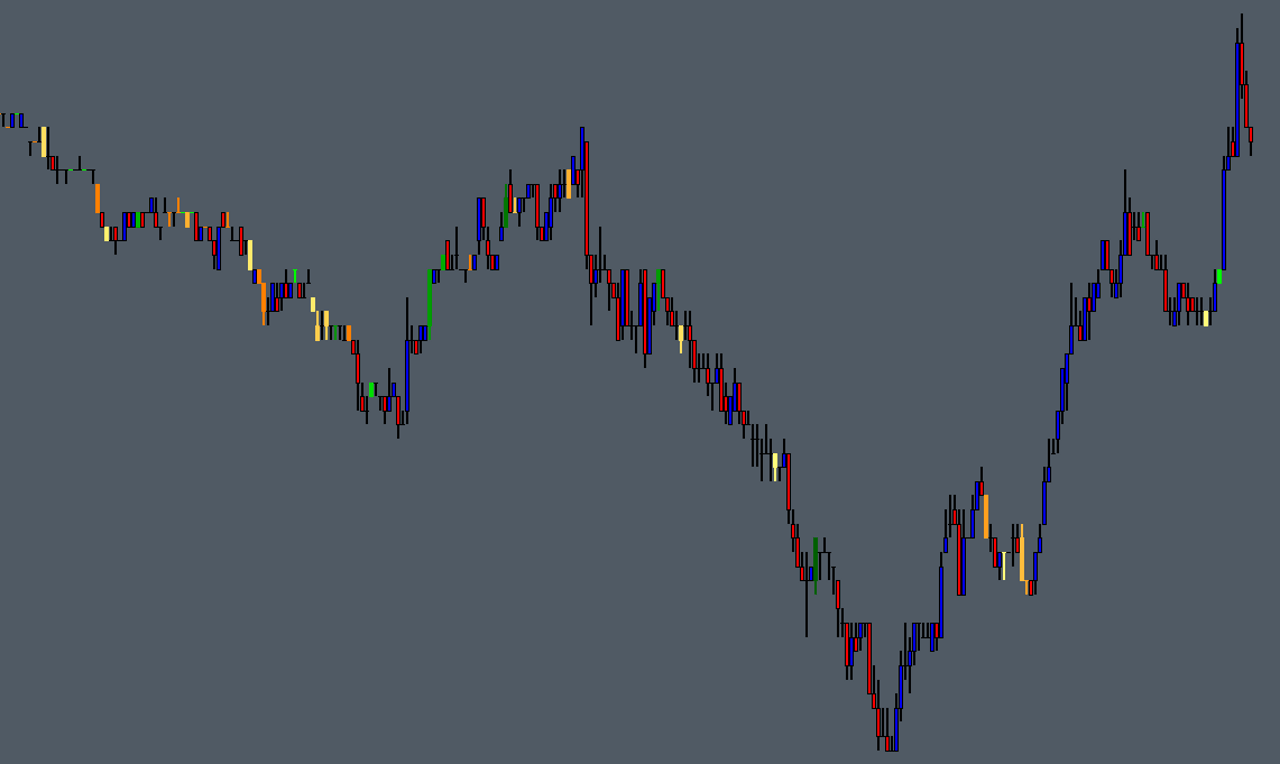
The Delta Colored Bars Study can be used to color the main price chart bars according to the imbalance between ask volume and bid volume for the chart bar.
Note:
- This study can only be used on charts with a chart data type of ‘Intraday Chart‘
- It is recommended to use ‘Intraday Data Storage Time Unit‘ setting ‘1 Tick’
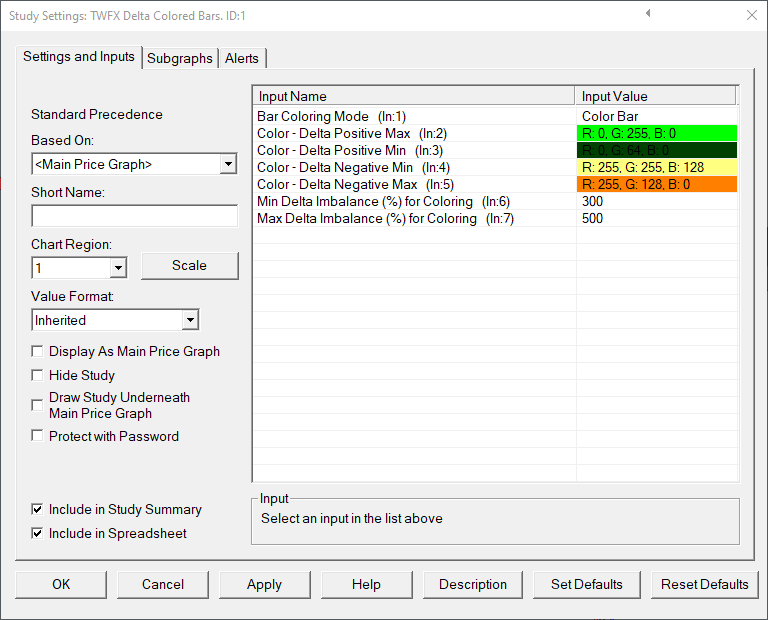
Inputs
Bar Coloring Mode (In:1)
Set the draw style for the ‘Delta Colored Bars’ subgraph.
Options: Color Bar; Color Bar Outline; Color Bar Fill; or None.
Color – Delta Positive Max (In:2)
Defines the color used when delta is positive (i.e. ask volume > bid volume) and the ‘Maximum Delta Imbalance for Coloring’ value is met or exceeded.
Color – Delta Positive Min (In:3)
Defines the color used when delta is positive and the imbalance is equal to the ‘Minmum Delta Imbalance for Coloring’ value.
Note: When the delta imbalance is between the Minimum and Maximum Delta Imbalance for Coloring values, then the color used will be interpolated between ‘Color – Delta Positive Max’ and ‘Color – Delta Positive Min’. If the delta imbalance is less than ‘Minmum Delta Imbalance for Coloring’, then the standard bar chart coloring will be used.
Color – Delta Negative Min (In:4)
Defines the color used when delta is neagtive (i.e. ask volume < bid volume) and the imbalance is equal to the ‘Minmum Delta Imbalance for Coloring’ value.
Note: When the delta imbalance is between the Minimum and Maximum Delta Imbalance for Coloring values, then the color used will be interpolated between ‘Color – Delta Negative Max’ and ‘Color – Delta Negative Min’. If the delta imbalance is less than ‘Minmum Delta Imbalance for Coloring’, then the standard bar chart coloring will be used.
Color – Delta Negative Max (In:5)
Defines the color used when delta is negative and the ‘Maximum Delta Imbalance for Coloring’ value is met or exceeded.
Min Delta Imbalance (%) for Coloring (In:6)
Defines the minimum imbalance required before positve or negative delta colors are applied.
- Min: 101
- Max: 500
Max Delta Imbalance (%) for Coloring (In:7)
Defines the maximum imbalance value used when determining coloring..
- Min: 101
- Max: 1000
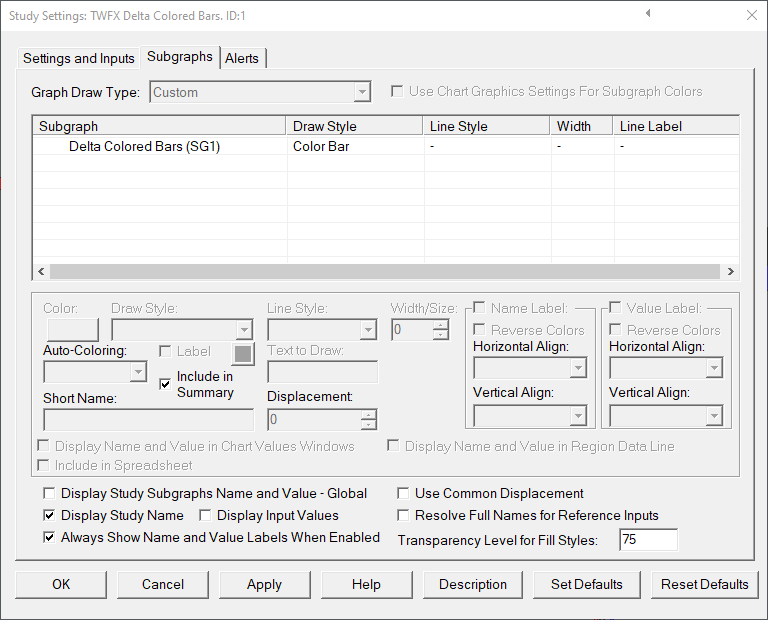
Subgraphs
Delta Colored Bars (SG1)
Default: Color Bar
Colors the main chart price bars when delta imbalance conditions are met.
Drawstyle options: Color Bar; Color Bar Fill; Color Bar Outline; or Ignore;
Note: Subgraph draw style is automatically set based on the study configuration.