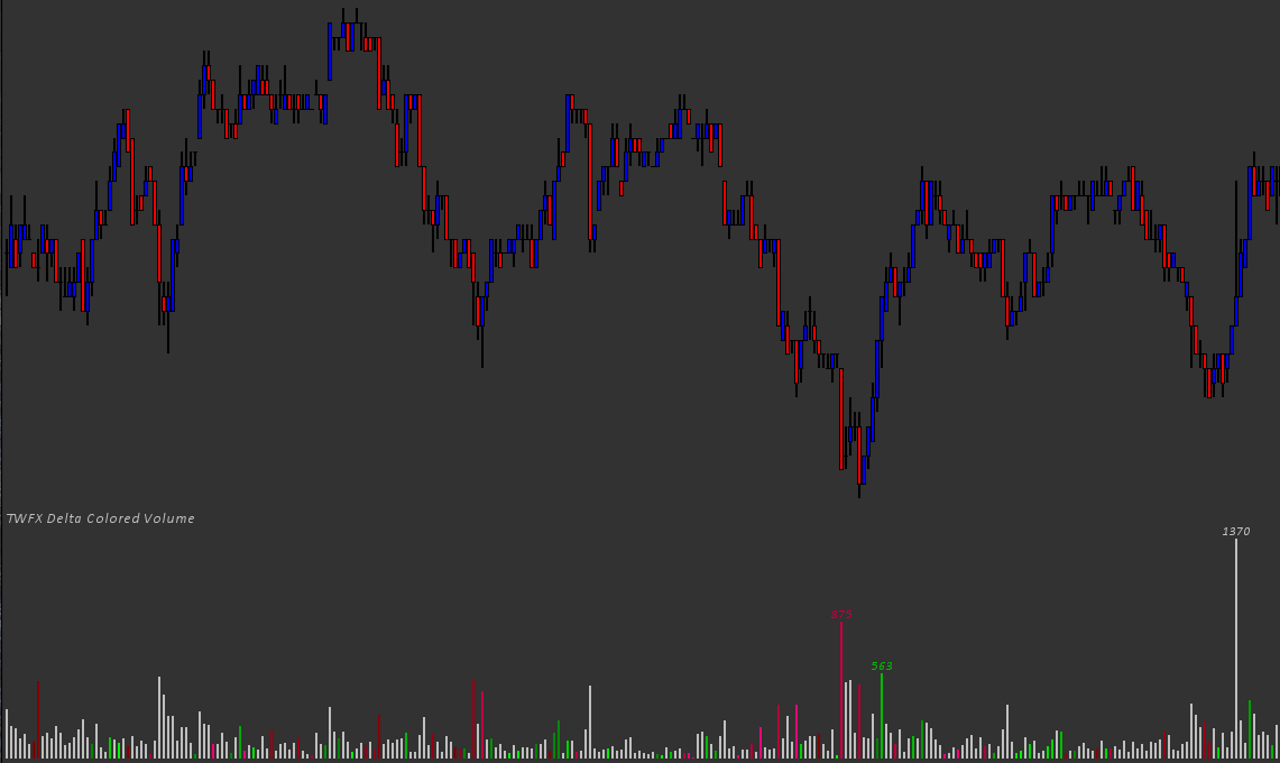
The Delta Colored Volume Study displays traded volume as a histogram, showing total volume per chart bar, the histogram bars are colored according to the imbalance between ask volume and bid volume for the chart bar.
Text can also optionally be display above the histogram bars, either showing total volume or the difference (delta) between the ask volume and bid volume.
Note:
- This study can only be used on charts with a chart data type of ‘Intraday Chart‘
- It is recommended to use ‘Intraday Data Storage Time Unit‘ setting ‘1 Tick’
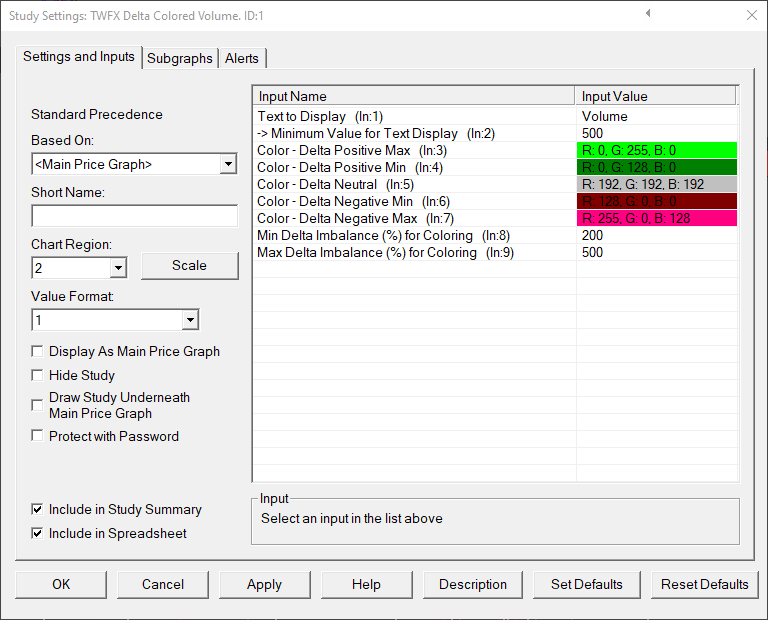
Inputs
Text to Display (In:1)
Defines the text to be displayed above the volume histogram bars.
Options: None; Volume; or Delta.
Minimum Value for Text Display (In:2)
Defines the minimum absolute value required before Volume or Delta text is displayed.
- Min: 0
- Max: 1000000
Color – Delta Positive Max (In:3)
Defines the color used when delta is positive (i.e. ask volume > bid volume) and the ‘Maximum Delta Imbalance for Coloring’ value is met or exceeded.
Color – Delta Positive Min (In:4)
Defines the color used when delta is positive and the imbalance is equal to the ‘Minmum Delta Imbalance for Coloring’ value.
Note: When the delta imbalance is between the Minimum and Maximum Delta Imbalance for Coloring values, then the color used will be interpolated between ‘Color – Delta Positive Max’ and ‘Color – Delta Positive Min’.
Color – Delta Neutral (In:5)
Defines the color used when ask volume is equal to bid volume, or when delta imbalance is < ‘Minmum Delta Imbalance for Coloring’.
Color – Delta Negative Min (In:6)
Defines the color used when delta is neagtive (i.e. ask volume < bid volume) and the imbalance is equal to the 'Minmum Delta Imbalance for Coloring' value. Note: When the delta imbalance is between the Minimum and Maximum Delta Imbalance for Coloring values, then the color used will be interpolated between ‘Color – Delta Negative Max’ and ‘Color – Delta Negative Min’.
Color – Delta Negative Max (In:7)
Defines the color used when delta is negative and the ‘Maximum Delta Imbalance for Coloring’ value is met or exceeded.
Min Delta Imbalance (%) for Coloring (In:8)
Defines the minimum imbalance required before positve or negative delta colors are applied.
- Min: 101
- Max: 500
Max Delta Imbalance (%) for Coloring (In:9)
Defines the maximum imbalance value used when determining coloring.
- Min: 101
- Max: 1000
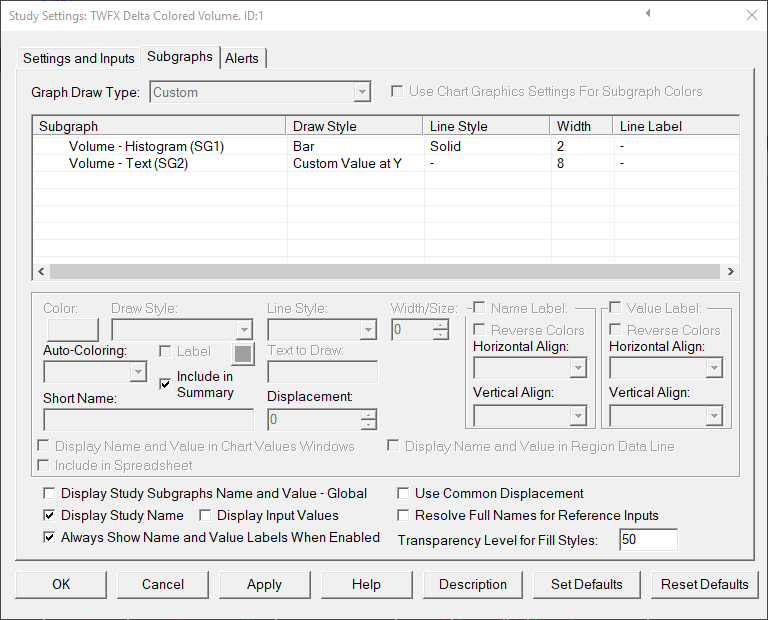
Subgraphs
Volume – Histogram (SG1)
Default: Bar
Displays the total traded volume per chart bar.
Volume – Text (SG2)
Default: Custom Value at Y
Displays either the total traded volume per bar or the difference between ask volume and bid volume per chart bar, when the ‘Minimum Value for Text Display’ is met or exceeded.
Drawstyle options: Custom Value at Y; Custom Value at Y with Border; Transparent Custom Value at Y; Ignore; and Hidden.