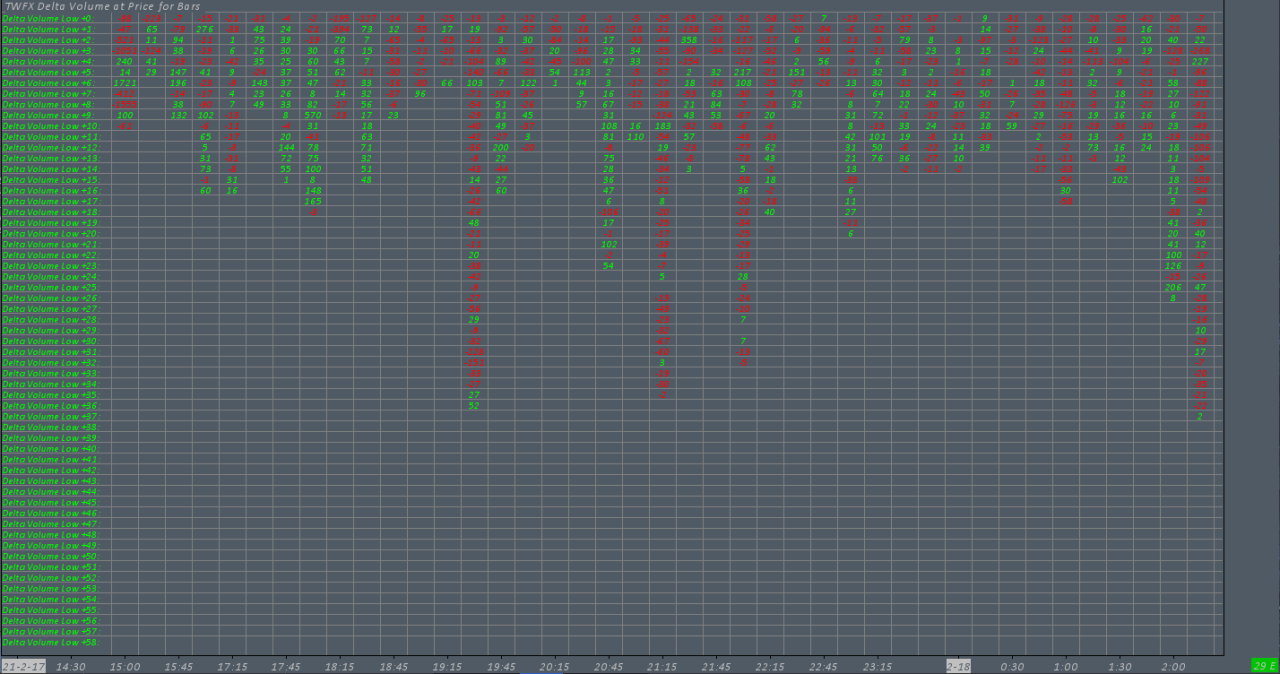
The Delta Volume at Price for Bars study monitors upto 59 price levels per chart bar (from low to high) and exposes the volume at price data via subgraphs.
The subgraph data can be displayed in a numeric information and/or used for configuring volume at price based alerts or referencing by a spreadsheet study for more in depth analysis.
Note:
- This study can only be used on charts with a chart data type of ‘Intraday Chart‘
- It is recommended to use ‘Intraday Data Storage Time Unit‘ setting ‘1 Tick’
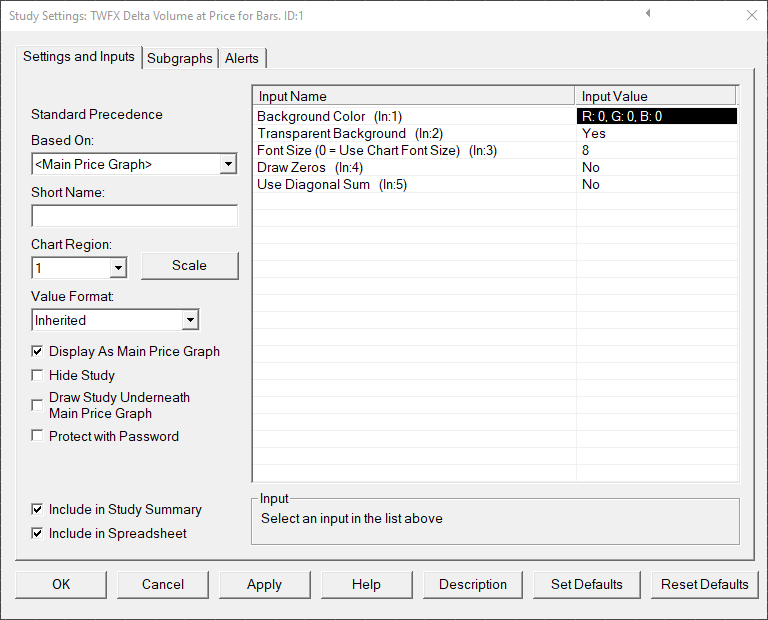
Inputs
Background Color (In:1)
Specify the background color to be used for the numeric information table.
Transparent Background (In:2)
Background Color is ignored and numeric information table is drawn with transparent background.
Font Size (0 = Use Chart Font Size) (In:3)
Defines the font size (in pixels) used for the numeric information table display.
Note: Use Chart Font Size is not compatible with OpenGL graphics, in this case the font size must be set to the preferred size.
- Min: 0
- Max: 100
Draw Zeros (In:4)
If Draw Zeros is enabled, then all cells in the numeric information table that would otherwise be empty will instead be filled with zeros.
Use Diagonal Sum (In:5)
When enabled, delta is calculated by subtracting the bid volume at price from the next highest ask volume at price, otherwise bid volume at price is subtracted from ask volume at price.
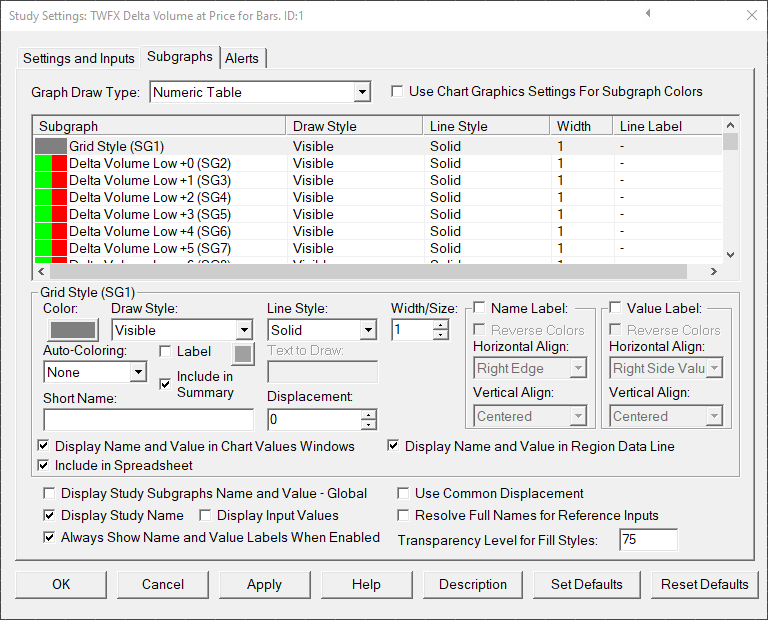
Subgraphs
Default: Visible
Defines the visibility, color, linestyle and line width used for the grid of the numeric information table.
to
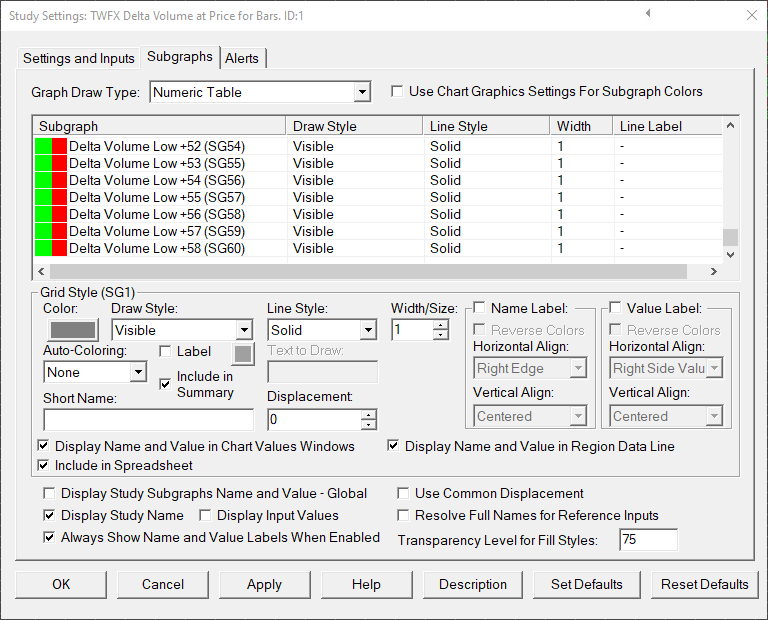
Delta Volume Low +58 (SG60)
Default: Visible
Defines the visibility and color used for Delta Volume subgraphs.
Displays the delta volume at price for the upto 59 price levels (starting at the low of the chart bar).