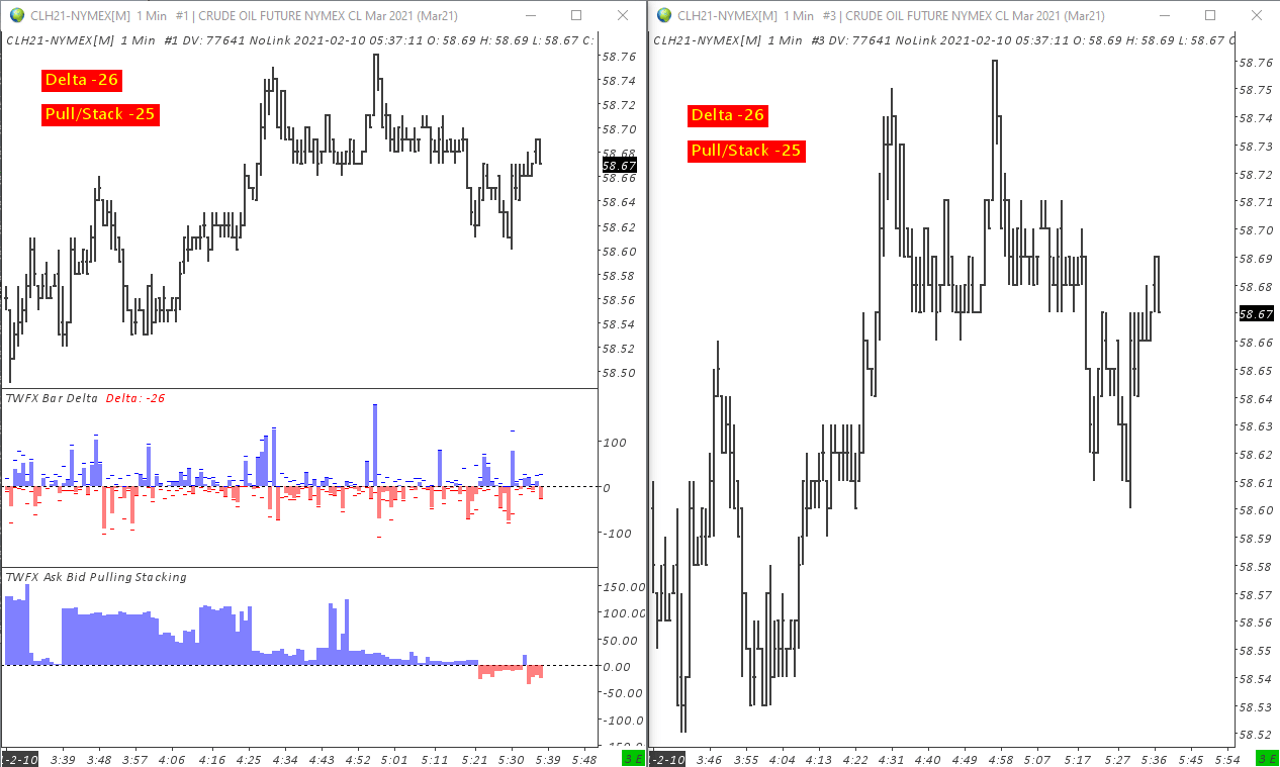
The Text Display for Study from Chart Study can be used to display the current value of a study subgraph, either on the same chart or another chart within the same chartbook.
Options are provided to control the position and appearance of the text display output, including different coloring for positive and negative values.
The name of the subgraph can also optionally be displayed, along with a user configurable prefix and/or suffix.
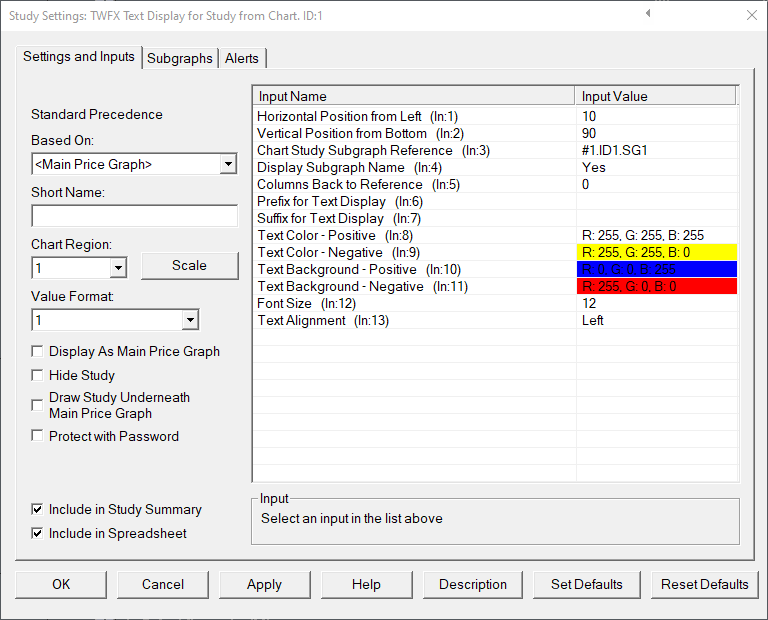
Inputs
Horizontal Position from Left (1-150) (In:1)
Defines the text display horizontal position, measured from the left hand side of the chart window.
- Min: 1
- Max: 150
Vertical Position from Bottom (1-100) (In:2)
Vertical Position from Bottom Defines the text display vertical position, measured from the bottom of the chart region to which the study is applied.
- Min: 1
- Max: 100
Chart Study Subgraph Reference (In:3)
Defines the study subgraph to be referenced by the text display study, can be on the same chart or a separate chart within the same chartbook.
Display Subgraph Name (In:4)
When enabled, the referenced study subgraph name will be displayed as a prefix to the subgraph value.
Note: If a study subgraph has a ‘Short Name’ defined, then this will be used instead of the standard subgraph name.
Columns Back to Reference (In:5)
Defines how many columns back to reference when retrieving the reference study subgraph value.
- Min: 0 (Always display the most recent study subgraph value, updated in realtime)
- Max: 100
Prefix for Text Display (In:6)
Enables the display of a user configured prefix, this can be used in addition to, or in place of the subgraph name prefix. The display order used is Prefix; Subgraph Name; Value; Suffix.
Suffix for Text Display (In:7)
Enables the display of a user configured suffix.
Text Color – Positive (In:8)
Defines the text color used when the reference study subgraph value is >= 0.
Text Color – Negative (In:9)
Defines the text color used when the reference study subgraph value is <0.
Text Background – Positive (In:10)
Defines the text background color used when the reference study subgraph value is >=0.
Text Background – Negative (In:11)
Defines the text background color used when the reference study subgraph value is <0.
Font Size (In:12)
Defines the font size used by the text display study.
Text Alignment (In:13)
Defines the horizontal alignment of the text display value, relative to the ‘Horizontal Position from Left’ value.
Options: Left; Center; or Right.