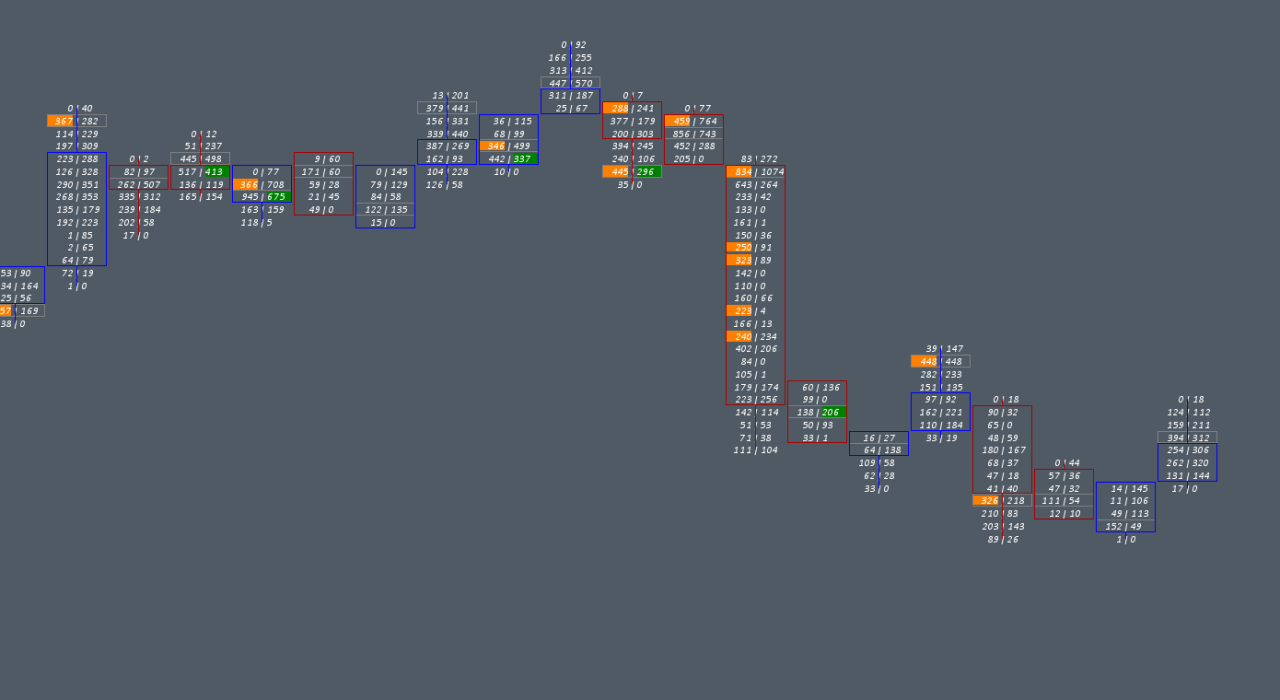
The Imbalance study monitors volume at price data and checks for user defined Buy and Sell imbalance conditions at each price level within each chart bar, up to 30 buy side imbalance levels and 30 sell side imbalance levels can be displayed per chart bar.
For the purposes of this study, imbalance is defined as volume at a price level within a single chart bar, exceeding all of the following parameters: Minimum Volume at Price Threshold; Minimum Bid / Ask Difference; and Minimum Imbalance %. If the Ask Volume at Price is greater than the Bid Volume at Price then a Buy Side Imbalance is said to have occurred, whereas if Bid Volume at Price is greater than Ask Volume at Price then a Sell Side Imbalance is said to have occurred.
Note: When comparing Ask and Bid volumes a diagonal comparison is performed, i.e. the Bid Volume at price is compared to the next highest Ask Volume at price.
Note:
- This study can only be used on charts with a chart data type of ‘Intraday Chart‘
- It is recommended to use ‘Intraday Data Storage Time Unit‘ setting ‘1 Tick’
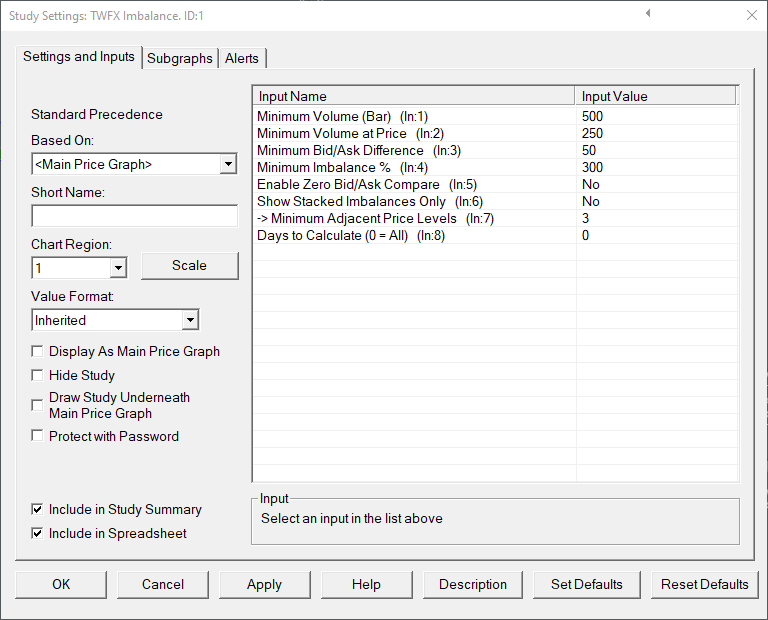
Inputs
Defines the minimum volume required for a chart bar to be evaluated for imbalance at price conditions.
- Min: 0
- Max: 1000000
Minimum Volume at Price (In:2)
Defines the minimum total volume required at a price level within a chart bar before that price level is evaluated further.
- Min: 0
- Max: 1000000
Minimum Bid/Ask Difference (In:3)
Defines the minium difference between ask and bid volume required at a price level within a chart bar before that price level is evaluated further.
- Min: 0
- Max: 1000000
Minimum Imbalance % (In:4)
Defines the minimum dominant side volume, expressed as a percentage of the non-dominant side, that is required at a price level within a chart bar for that level to be considered as an imbalance.
- Min: 101
- Max: 1000
Enable Zero Bid/Ask Compare (In:5)
Defines whether a comparison is made when either Ask or Bid volume is zero. When enabled, for the purposes of the imbalance calculation, 1 is substituted for 0, otherwise no comparison is made and the level is skipped.
Show Stacked Imbalances Only (In:6)
When enabled, imbalances will only be highlighted when the ‘Minimum Adjacent Price Levels’ condition is satisfied, i.e. there are consistent imbalances across adjacent price levels.
Minimum Adjacent Price Levels (In:7)
Defines the minimum adjacent imbalances (of the same type) that are required to be considered as a stacked imbalance.
- Min: 2
- Max: 10
Days to Calculate (In:8)
Defines the number of days over which the study is calculated, can be used to reduce the initial study calculation time when many days worth of data is loaded into the chart but this study is only required to be shown on the most recent days.
- Min: 0 (in which case all loaded bars are evaluated during the study calculation)
- Max: 1000000
Subgraphs
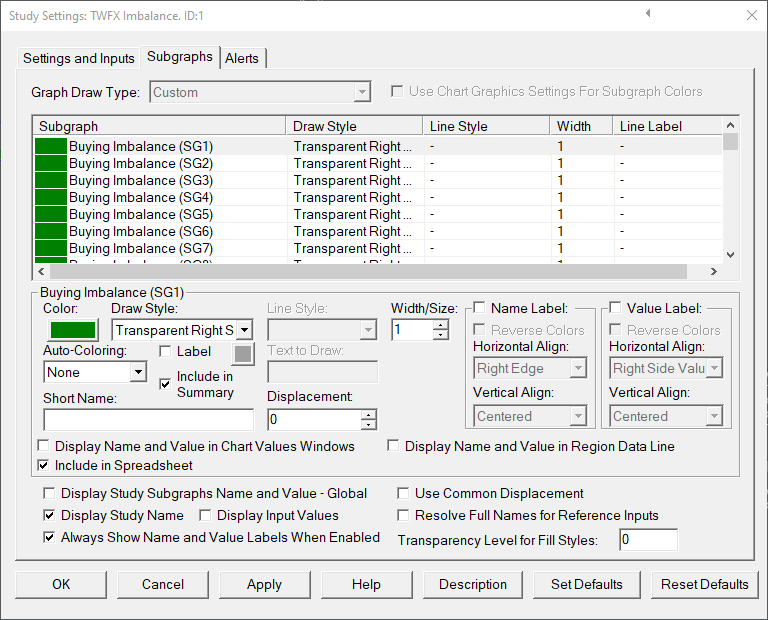
Default: Transparent Right Side Tick Size Rectangle
Defines the subgraph draw style properties used for Buying Imbalance Subgraphs
Note: The draw style, color and size properties are automatically copied from subgraph 1 to subgraphs 2-30.
Displays the imbalance buying levels with each chart bar, price levels are evaluated starting from the bar low price.
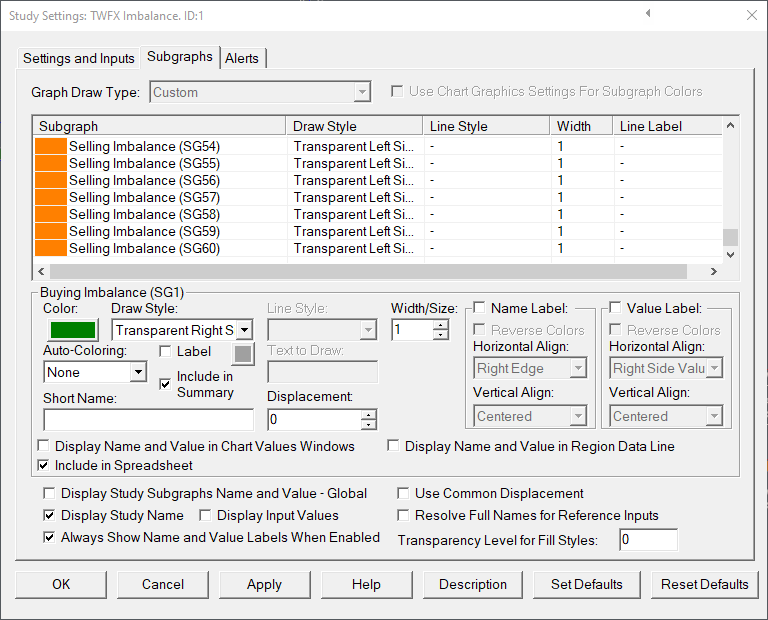
Selling Imbalance (SG31-60)
Default: Transparent Left Side Tick Size Rectangle
Defines the subgraph draw style properties used for Selling Imbalance Subgraphs
Note: The draw style, color and size properties are automatically copied from subgraph 31 to subgraphs 32-60.
Displays the selling imbalance levels with each chart bar, price levels are evaluated starting from the bar low price.


