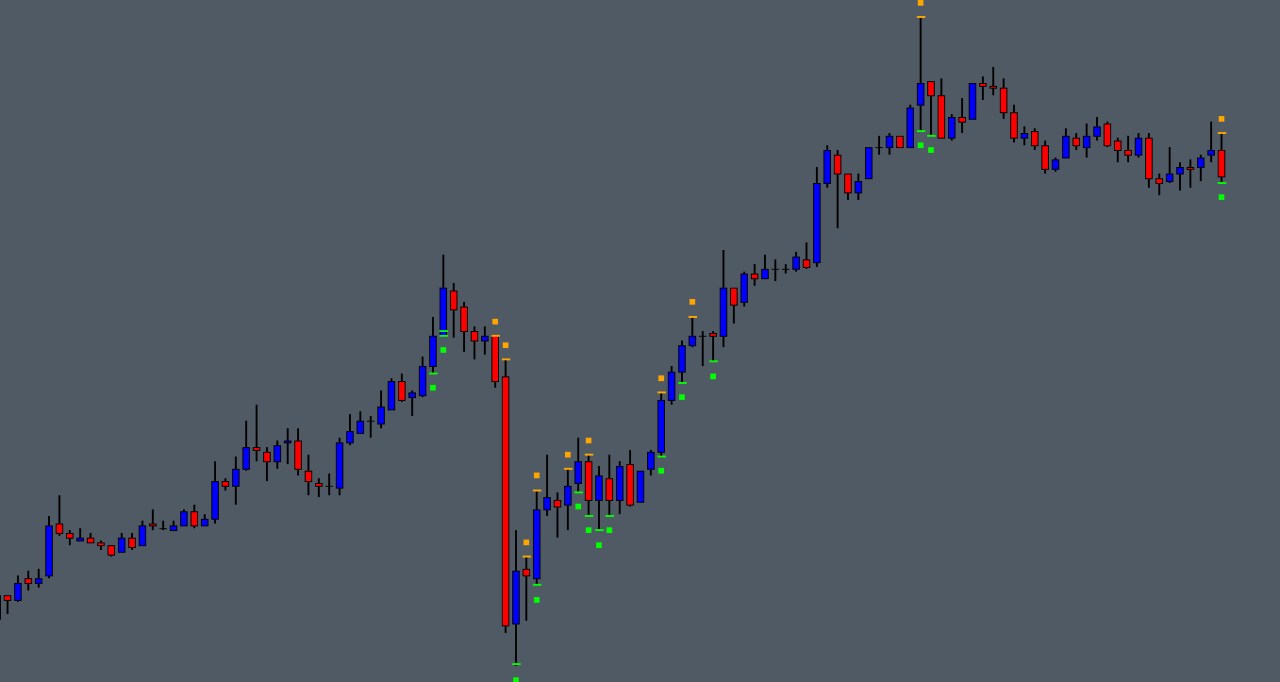
The Single Print High Low study monitors volume at price data and checks for single prints at the lowest and highest price levels within each chart bar, up to 5 buy side single prints and 5 sell side single prints can be displayed per chart bar.
For the purposes of this study, a single print is defined as either: A price level at or near the low of a chart bar having sell side volume greater than 0 and less than 10; or a price level at or near the high of a chart bar having buy side volume greater than 0 and less than 10.
In addition to displaying markers at single print price levels, the study also displays a marker above and/or below the chart bar to indicate whether buy and/or sell single prints have been detected within the chart bar.
Note:
- This study can only be used on charts with a chart data type of ‘Intraday Chart‘
- It is recommended to use ‘Intraday Data Storage Time Unit‘ setting ‘1 Tick’
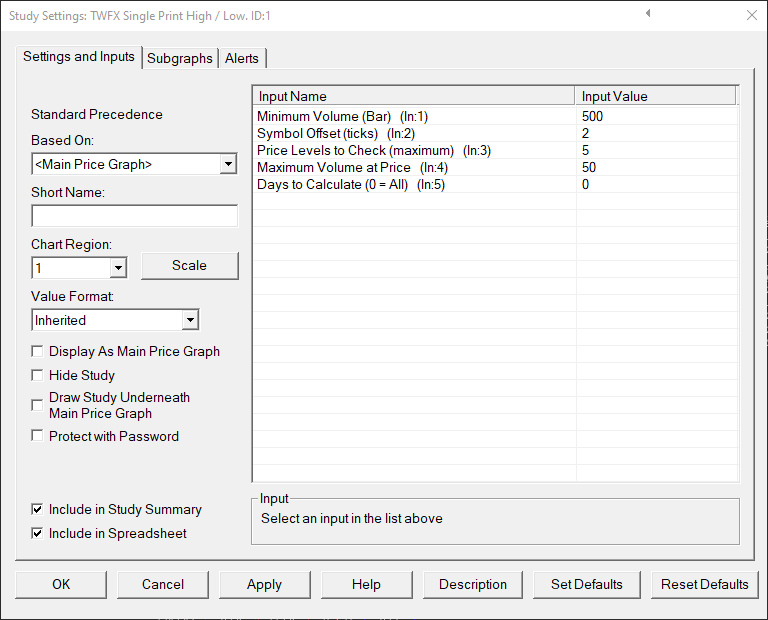
Inputs
Defines the minimum volume required for a chart bar to be evaluated for single prints at price.
- Min: 0
- Max: 1000000
Symbol Offset (In:2)
Defines the offset, in ticks, from the bar high/low at which to display the single print detected symbols.
- Min: 0
- Max: 10
Defines the number of price levels at the high and low over which to check for single prints. The number of levels checked will always be the lesser of ‘Price Levels to Check’ and ‘price levels per chart bar / 2’.
- Min: 1
- Max: 5
Maximum Volume at Price (In:4)
Defines the maximum total volume permitted at a price level within a chart bar for that price level to be evaluated for single print volume.
- Min: 0
- Max: 1000000
Days to Calculate (In:5)
Defines the number of days over which the study is calculated, can be used to reduce the initial study calculation time when many days worth of data is loaded into the chart but this study is only required to be shown on the most recent days.
- Min: 0 (in which case all loaded bars are evaluated during the study calculation)
- Max: 1000000
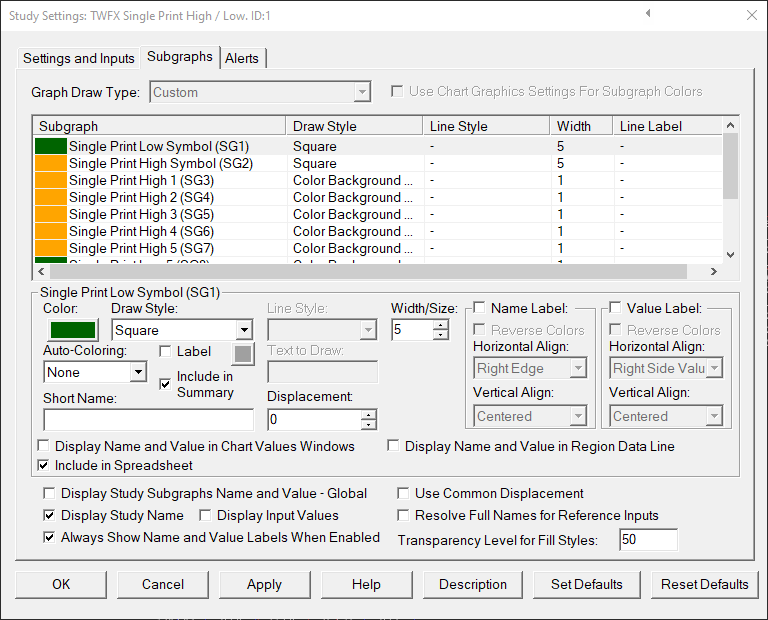
Subgraphs
Default: Square
Defines the subgraph draw style properties used for the Single Print Low Symbol Subgraph
Displays a symbol at / below the bar low if a single print is detected within the specified price levels at/near the chart bar low price.
Single Print High Symbol (SG2)
Default: Square
Defines the subgraph draw style properties used for the Single Print High Symbol Subgraph
Displays a symbol at / above the bar high if a single print is detected within the specified price levels at/near the chart bar high price.
Single Print High 1 (SG3)
Single Print High 2 (SG4)
Single Print High 3 (SG5)
Single Print High 4 (SG6)
Single Print High 5 (SG7)
Default: Color Background at Price
Defines the subgraph draw style properties used for Single Print High Subgraphs (single print buying at / near bar high)
Note: The draw style, color and size properties are automatically copied from subgraph 3 to subgraphs 4-7.
Displays the single print buying levels with each chart bar, price levels are evaluated starting from the bar high price.
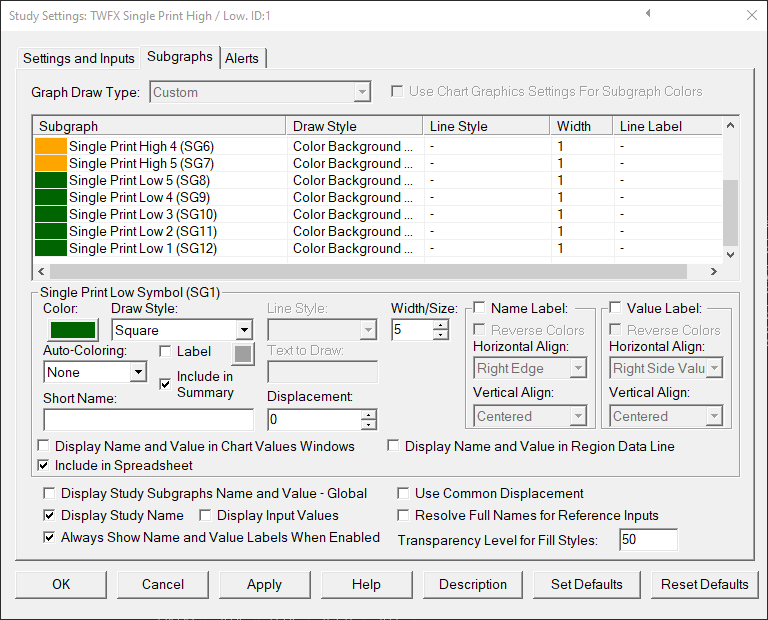
Single Print Low 5 (SG8)
Single Print Low 4 (SG9)
Single Print Low 3 (SG10)
Single Print Low 2 (SG11)
Single Print Low 1 (SG12)
Default: Color Background at Price
Defines the subgraph draw style properties used for Single Print Low Subgraphs (single print selling at / near bar low)
Note: The draw style, color and size properties are automatically copied from subgraph 12 to subgraphs 11-8.
Displays the single print selling levels with each chart bar, price levels are evaluated starting from the bar low price.