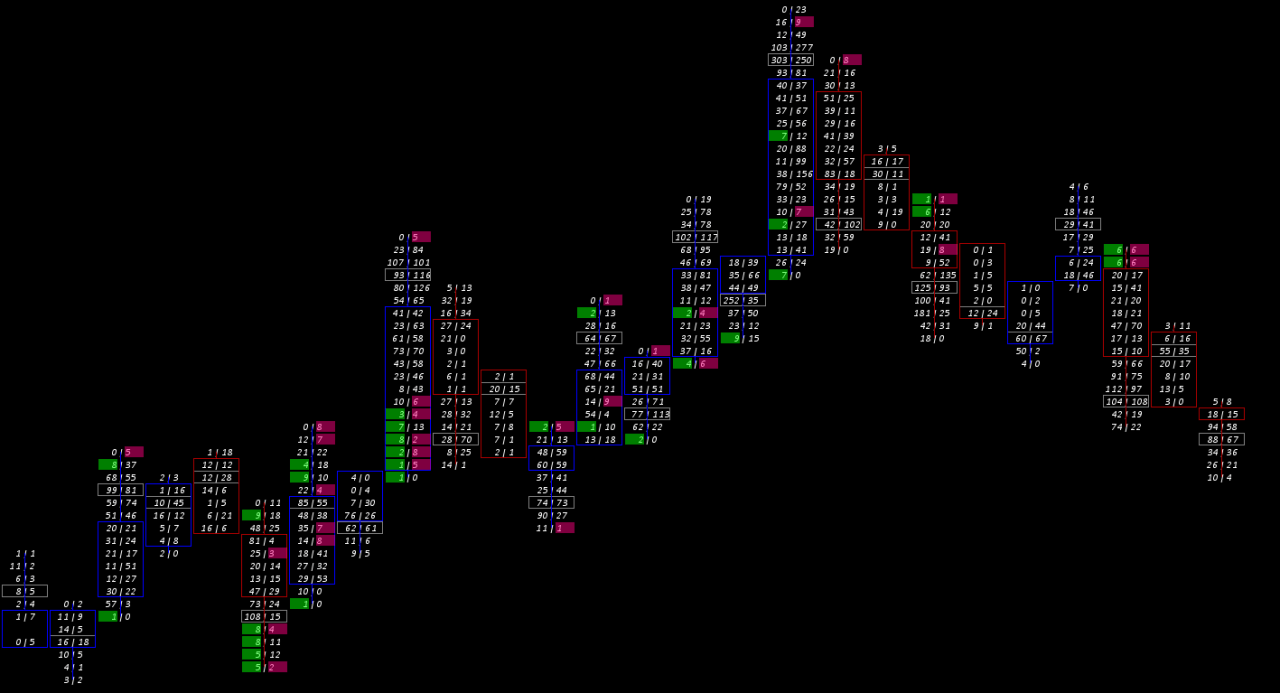
The Single Print study monitors volume at price data and checks for single prints at each price level within each chart bar, up to 30 buy single prints and 30 sell side sinlge print levels can be displayed per chart bar.
For the purposes of this study, a single print is defined as either: A price level having sell side volume greater than 0 and less than 10; or a price level having buy side volume greater than 0 and less than 10.
Note: The highest price level in the chart bar is not checked for sell side single print, nor is the lowest price level in the chart bar checked for buy side single print, as either of these conditions would usually indicate an unfinished auction.
Note:
- This study can only be used on charts with a chart data type of ‘Intraday Chart‘
- It is recommended to use ‘Intraday Data Storage Time Unit‘ setting ‘1 Tick’
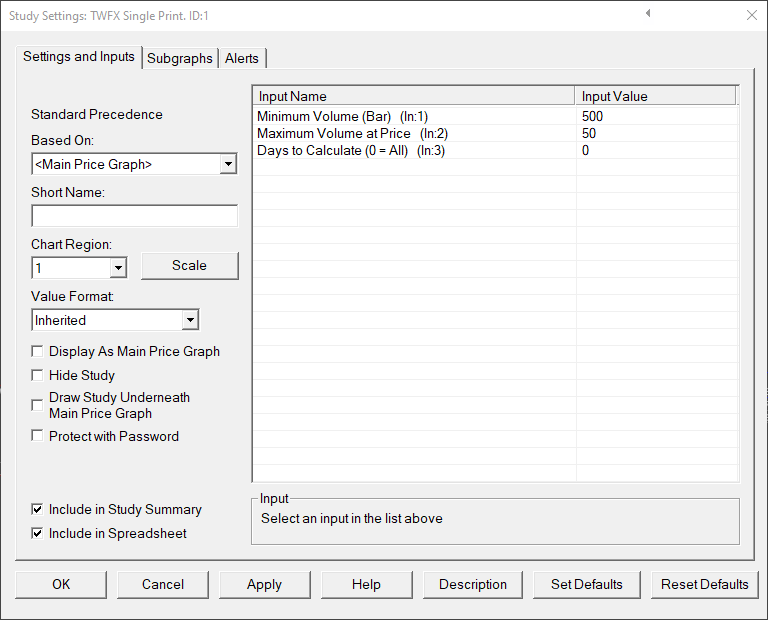
Inputs
Defines the minimum volume required for a chart bar to be evaluated for single prints at price.
- Min: 0
- Max: 1000000
Maximum Volume at Price (In:2)
Defines the maximum total volume permitted at a price level within a chart bar for that price level to be evaluated for single print volume.
- Min: 0
- Max: 1000000
Days to Calculate (In:3)
Defines the number of days over which the study is calculated, can be used to reduce the initial study calculation time when many days worth of data is loaded into the chart but this study is only required to be shown on the most recent days.
- Min: 0 (in which case all loaded bars are evaluated during the study calculation)
- Max: 1000000
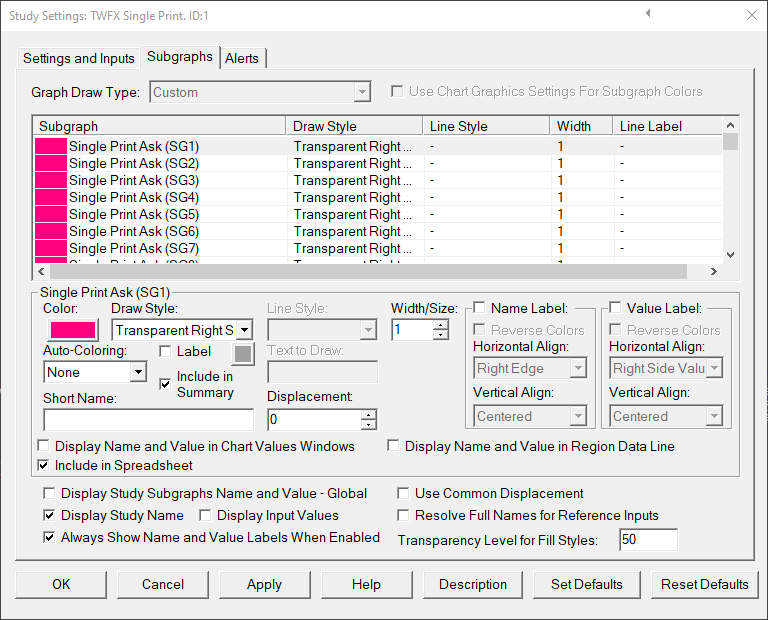
Subgraphs
Default: Transparent Right Side Tick Size Rectangle
Defines the subgraph draw style properties used for Single Print Ask Subgraphs
Note: The draw style, color and size properties are automatically copied from subgraph 1 to subgraphs 2-30.
Displays the single print buying levels within each chart bar, price levels are evaluated starting from the bar low price.
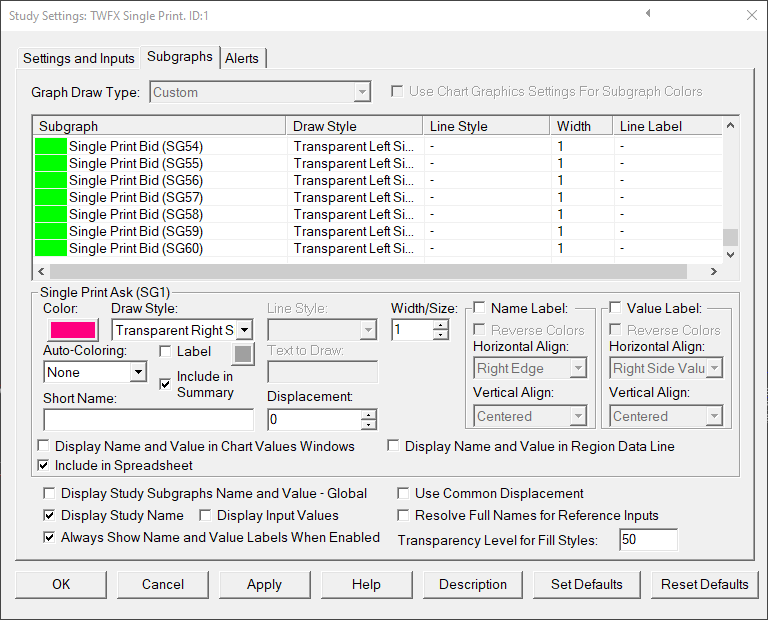
Single Print Bid (SG31-60)
Default: Transparent Left Side Tick Size Rectangle
Defines the subgraph draw style properties used for Single Print Bid Subgraphs
Note: The draw style, color and size properties are automatically copied from subgraph 31 to subgraphs 32-60.
Displays the single print selling levels within each chart bar, price levels are evaluated starting from the bar low price.