The Taper Volume study monitors volume at price data and checks for taper volume conditions at the lowest and highest price levels within each chart bar.
For the purposes of this study, taper volume is considered to be present when the following conditions are met: Maximum Volume at Bar Extreme is not exceeded; either Bid Volume equals zero (Bar High Taper) or Ask Volume equals zero (Bar Low Taper); and either Ask Volume reduces consistently across the specified number of price levels (Bar High Taper) or Bid Volume reduces consistently across the specified number of price levels (Bar Low Taper).
Note:
- This study can only be used on charts with a chart data type of ‘Intraday Chart‘
- It is recommended to use ‘Intraday Data Storage Time Unit‘ setting ‘1 Tick’
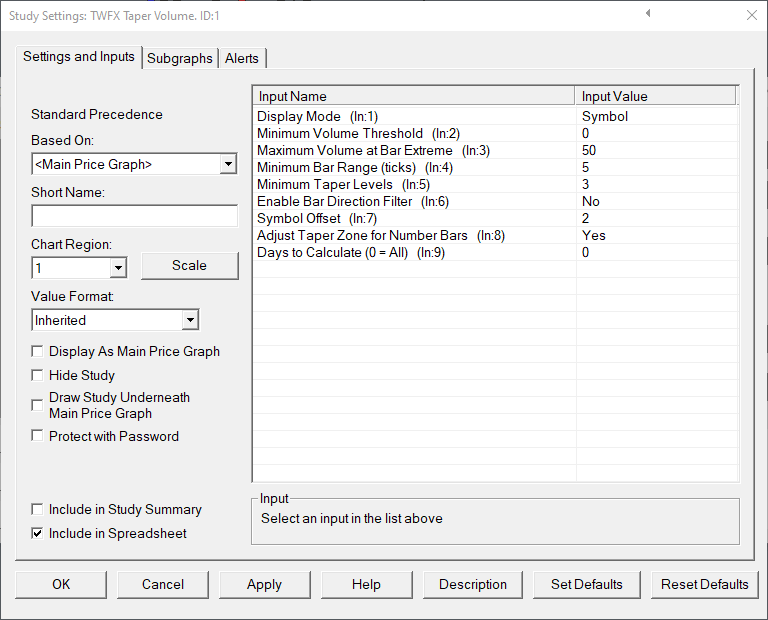
Inputs
Defines the minimum volume required for a chart bar to be evaluated for absorption at price conditions.
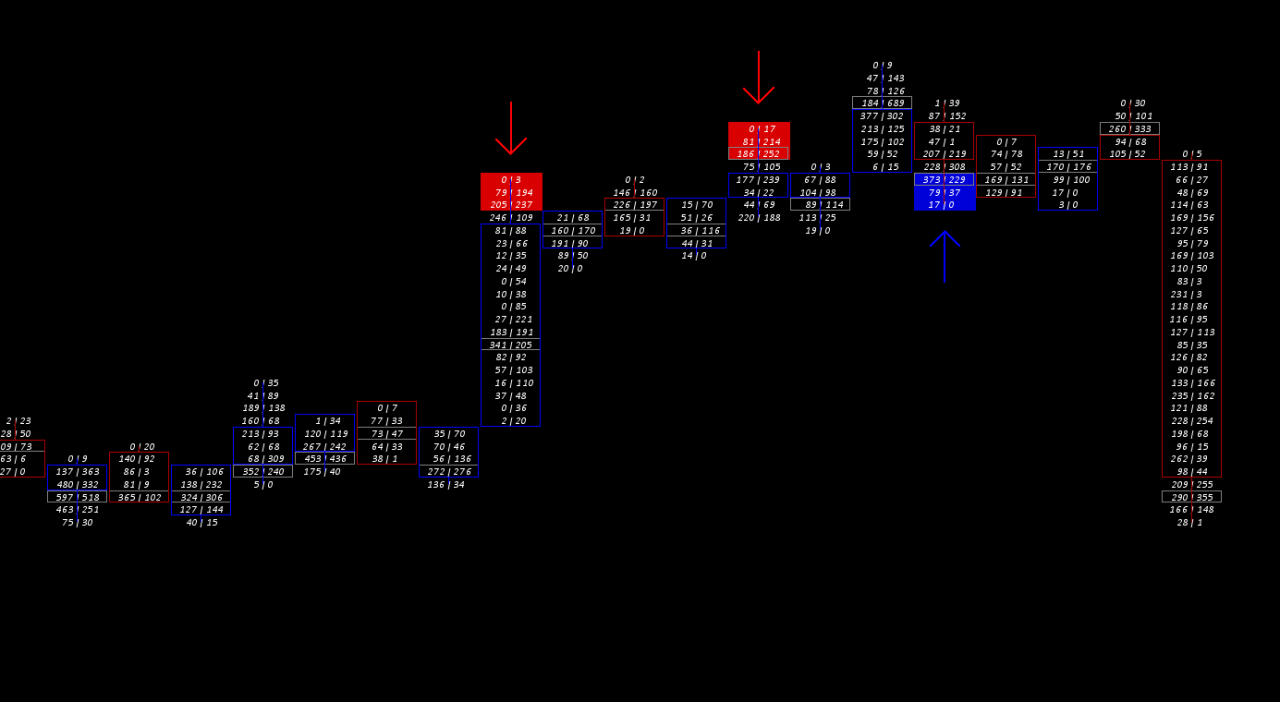
- Symbol: A symbol is display above the bar high or below the bar low.
- Zone: The price levels across which the taper has occurred are highlighted.
- Symbol & Zone: Both of the above indications are used.
Defines the minimum volume required for a chart bar to be evaluated for taper volume.
- Min: 0
- Max: 1000000
Defines the maximum permitted volume at the bar high or low for taper volume to be considered to have occurred.
- Min: 1
- Max: 1000000
Defines the minimum price range required (in ticks) before the chart bar is evaluated for taper volume.
- Min: 3
- Max: 20
Defines the minimum number of price levels across which volume must consistently reduced before taper volume is said to have occurred.
- Min: 3
- Max: 10
When enabled, only bearish chart bars (i.e. Close < Open) will be considered for bar low taper volume, whilst only bullish chart bars (i.e. Open > Close) will be considered for bar high taper volume.
Symbol Offset (In:7)
Defines the offset, in ticks, from the bar high/low at which to display the taper volume symbol(s).
- Min: 0
- Max: 10
When enabled the taper volume zone high and low are adjusted so that the zone displays correctly when used in conjunction with the number bars study.
Days to Calculate (In:9)
Defines the number of days over which the study is calculated, can be used to reduce the initial study calculation time when many days worth of data is loaded into the chart but this study is only required to be shown on the most recent days.
- Min: 0 (in which case all loaded bars are evaluated during the study calculation)
- Max: 1000000
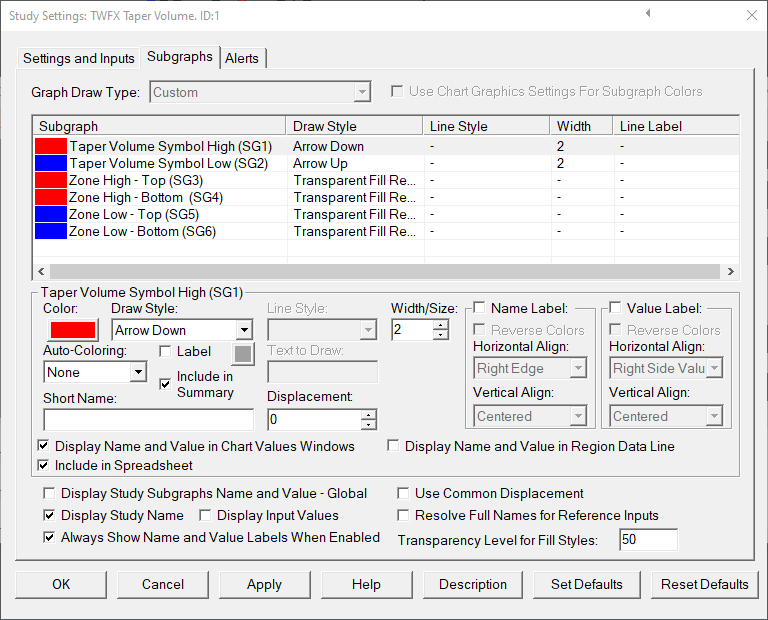
Subgraphs
Default: Arrow Down
Defines the subgraph draw style properties used for the Taper Volume Symbol High Subgraph
Displays a symbol at / above the bar high if buy side taper volume is detected within the specified price levels at/near the chart bar high price.
Taper Volume Symbol Low (SG2)
Default: Arrow Up
Defines the subgraph draw style properties used for the Taper Volume Symbol Low Subgraph
Displays a symbol at / below the bar low if sell side taper volume is detected within the specified price levels at/near the chart bar low price.
Zone High – Top (SG3)
Default: Transparent Fill Rectangle Top
Defines the subgraph draw style properties used for the taper volume zone high upper price level.
Options: Transparent Fill Rectangle Top; or Fill Rectangle Top
Zone High – Bottom (SG4)
Default: Transparent Fill Rectangle Bottom
Defines the subgraph draw style properties used for the taper volume zone high lower price level.
Options: Transparent Fill Rectangle Bottom; or Fill Rectangle Bottom
Zone High – Top and Zone High – Bottom are used simultaneously to draw a zone at the bar high when taper volume occurs.
Zone Low – Top (SG5)
Default: Transparent Fill Rectangle Top
Defines the subgraph draw style properties used for the taper volume zone low upper price level.
Options: Transparent Fill Rectangle Top; or Fill Rectangle Top
Zone Low – Bottom (SG6)
Default: Transparent Fill Rectangle Bottom
Defines the subgraph draw style properties used for the taper volume zone low lower price level.
Options: Transparent Fill Rectangle Bottom; or Fill Rectangle Bottom
Zone Low – Top and Zone Low – Bottom are used simultaneously to draw a zone at the bar low when taper volume occurs.