The Thin Prices study monitors volume at price data and checks for price levels (or sequences of price levels) where the total volume at price is less than the specified Maximum Volume at Price, these price levels or zones are described as Thin Prices due to the relative lack of volume as compared to typical price levels.
Note:
- This study can only be used on charts with a chart data type of ‘Intraday Chart‘
- It is recommended to use ‘Intraday Data Storage Time Unit‘ setting ‘1 Tick’
Inputs
Defines the minimum volume required for a chart bar to be evaluated for thin price levels.
- Min: 0
- Max: 1000000
Maximum Volume at Price (In:2)
Defines the maximum total volume permitted at a price level within a chart bar for that price level to be considered as a thin price level.
- Min: 0
- Max: 1000000
Show Thin Zones Only (In:3)
When enabled, thin zones will only be highlighted when the ‘Minimum Adjacent Price Levels’ condition is satisfied, i.e. there are consistent thin prices across adjacent price levels.
Minimum Adjacent Price Levels (In:4)
Defines the minimum adjacent thin prices that are required to be considered as a thin zone.
- Min: 2
- Max: 10
Days to Calculate (In:5)
Defines the number of days over which the study is calculated, can be used to reduce the initial study calculation time when many days worth of data is loaded into the chart but this study is only required to be shown on the most recent days.
- Min: 0 (in which case all loaded bars are evaluated during the study calculation)
- Max: 1000000

Subgraphs
Default: Color Background at Price
Defines the subgraph draw style properties used for Thin Price Subgraphs
Note: The draw style, color and size properties are automatically copied from subgraph 1 to subgraphs 2-60.
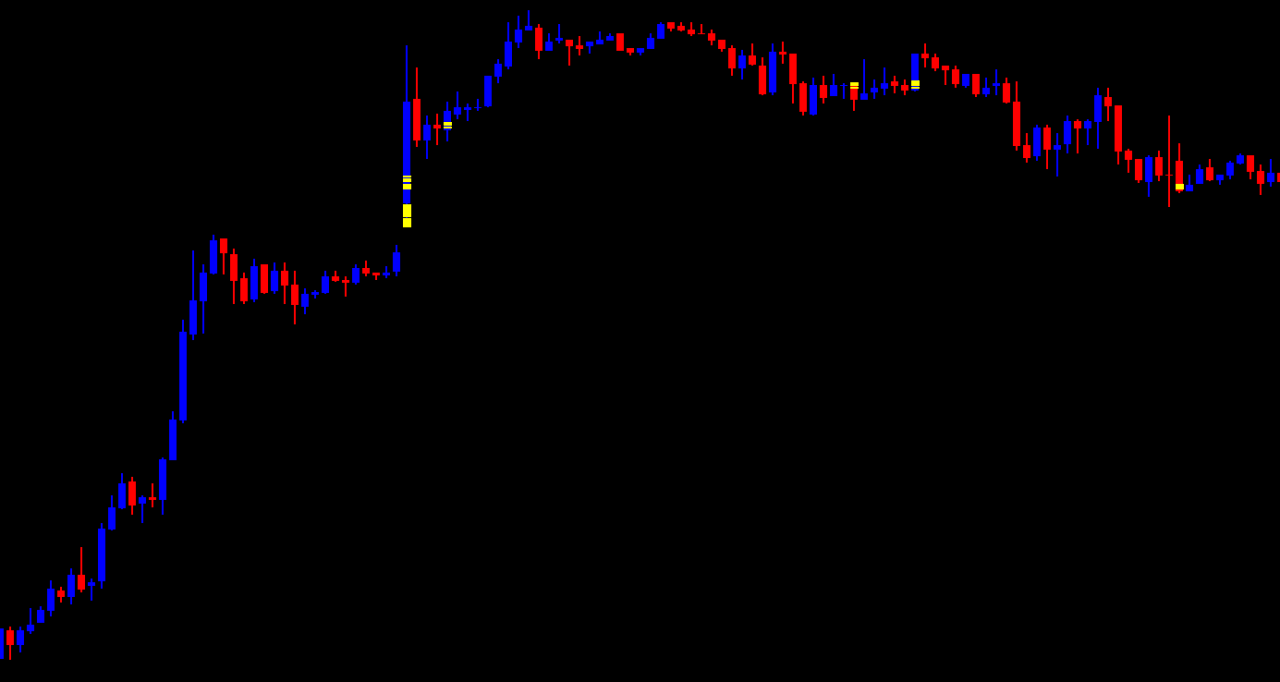
Displays the thin price levels with each chart bar, price levels are evaluated starting from the bar low price.
