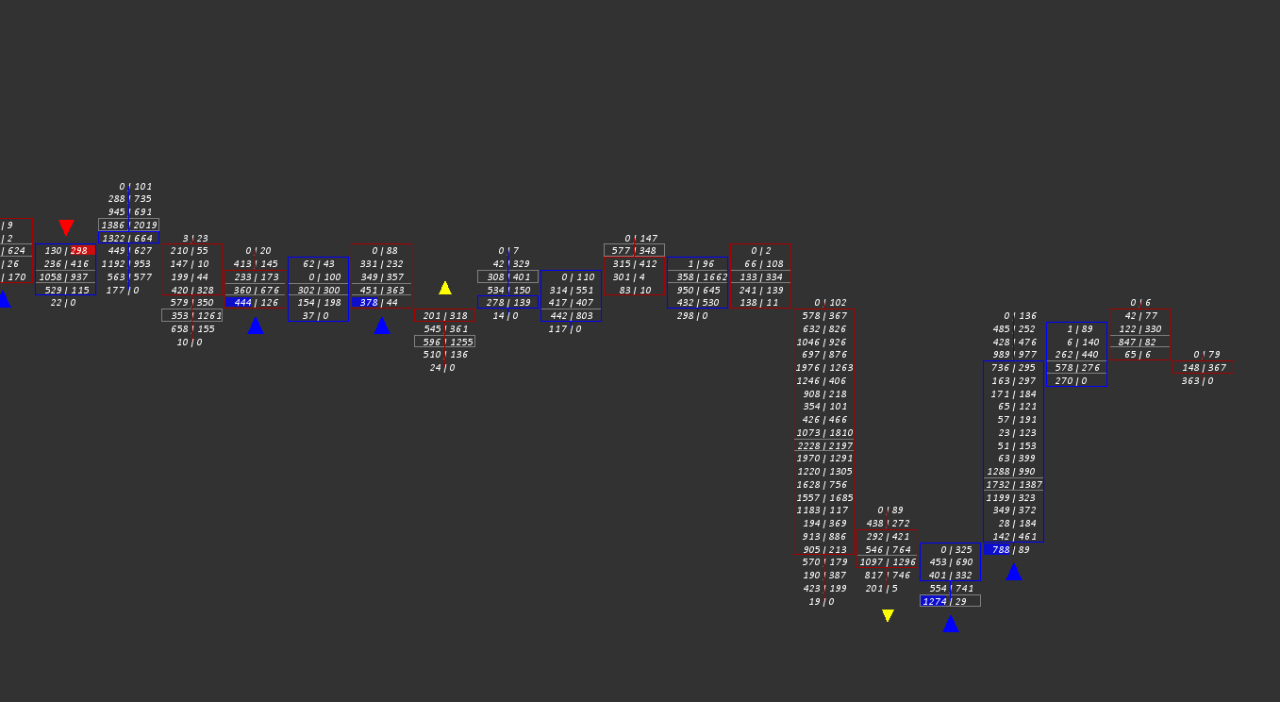
The Unfinished Auction study monitors volume at price data and checks for unfinished auction conditions at the high and low of each chart bar.
For the purposes of this study, an unfinished auction is said to have occurred when both the ask and bid sides have traded at the high and/or low of the chart bar.
Additionally the study can also be configured to check for buy side absorption at or near the bar high, or for sell side absorption at or near the bar low.
Note:
- This study can only be used on charts with a chart data type of ‘Intraday Chart‘
- It is recommended to use ‘Intraday Data Storage Time Unit‘ setting ‘1 Tick’
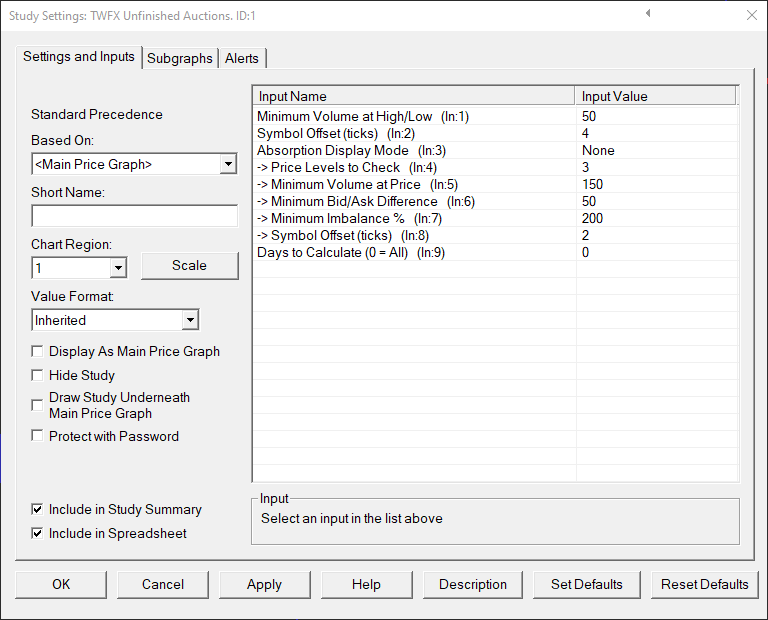
Inputs
Defines the minimum volume required at the bar high/low for an unfinished auction symbol to be displayed.
- Min: 0
- Max: 1000000
Symbol Offset (In:2)
Defines the offset, in ticks, from the bar high/low at which to display the unfinished auction symbols.
- Min: 0
- Max: 10
Absorption Display Mode (In:3)
Defines whether or not, after first detecting unfinished auction conditions, to also check for absorption conditions at/near the bar high/low and, when present, how this should be indicated on the chart.
- None: No check for absorption conditions.
- Symbol: Absorption conditions are checked for within the specified number of price levels of the unfinshed auction price, if absorption is detected then the relevant absorption symbol will be displayed in place of the unfinished auction symbol.
- Symbol and Prices: In addition to the symbol, the actual price levels at which absorption is detected are highlighted (up to 5 buy side absorption and/or 5 sell side absorption prices).
Defines the number of price levels at the high and low over which to check for absorption conditions. The number of levels checked will always be the lesser of ‘Price Levels to Check’ and ‘price levels per chart bar / 2’.
- Min: 1
- Max: 5
Minimum Volume at Price (In:5)
Defines the minimum total volume required at a price level within a chart bar before that price level is evaluated further.
- Min: 0
- Max: 1000000
Minimum Bid/Ask Difference (In:6)
Defines the minium difference between ask and bid volume required at a price level within a chart bar before that price level is evaluated further.
- Min: 0
- Max: 1000000
Minimum Imbalance % (In:7)
Defines the minimum dominant side volume, expressed as a percentage of the non-dominant side, that is required at a price level within a chart bar for that level to be considered as absorbed.
- Min: 101
- Max: 1000
Symbol Offset (In:8)
Defines the offset, in ticks, from the bar high/low at which to display the unfinished auction absorption symbols.
- Min: 1
- Max: 25
Days to Calculate (In:9)
Defines the number of days over which the study is calculated, can be used to reduce the initial study calculation time when many days worth of data is loaded into the chart but this study is only required to be shown on the most recent days.
- Min: 0 (in which case all loaded bars are evaluated during the study calculation)
- Max: 1000000
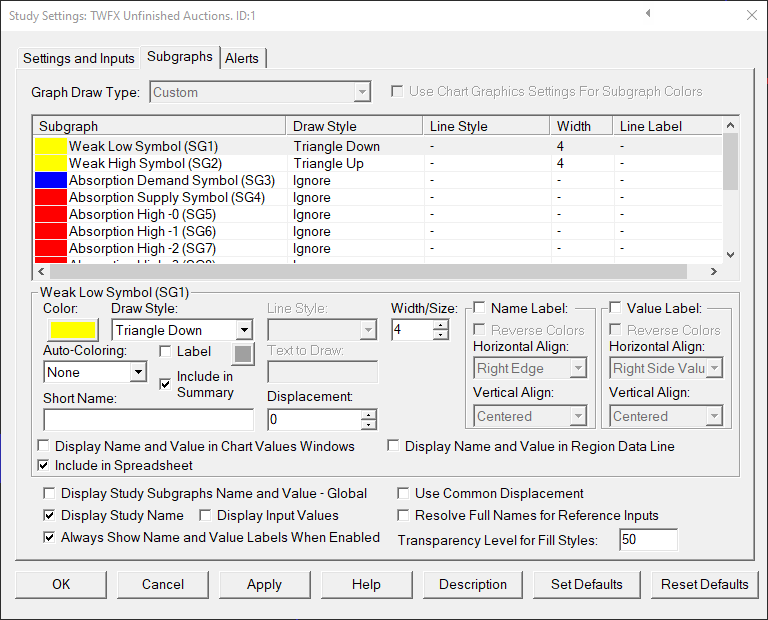
Subgraphs
Default: Triangle Down
Defines the subgraph draw style properties used for Weak Low Symbol Subgraph
Displays a symbol at / below the bar low if an unfinished auction occurs at the bar low.
Weak High Symbol (SG2)
Default: Triangle Up
Defines the subgraph draw style properties used for Weak High Symbol Subgraph
Displays a symbol at / above the bar high if an unfinished auction occurs at the bar high.
Absorption Demand Symbol (SG3)
Default: Disabled = Ignore; Enabled = Triangle Up
Defines the subgraph draw style properties used for Absorption Demand Symbol Subgraph
Displays a symbol at / below the bar low if sell side absorption occurs at or near to the bar low, in addition to an unfinished auction at the bar low.
Default: Disabled = Ignore; Enabled = Triangle Down
Defines the subgraph draw style properties used for Absorption Supply Symbol Subgraph
Displays a symbol at / above the bar high if buy side absorption occurs at or near to the bar high, in addition to an unfinished auction at the bar high.
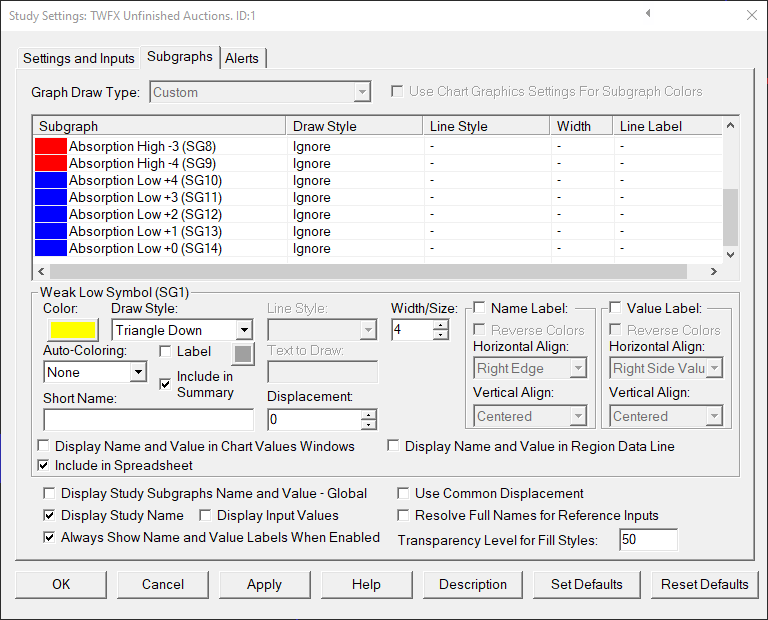
Absorption High -0 (SG5)
Absorption High -1 (SG6)
Absorption High -2 (SG7)
Absorption High -3 (SG8)
Absorption High -4 (SG9)
Default: Disabled = Ignore; Enabled = Transparent Right Side Tick Size Rectangle
Defines the subgraph draw style properties used for Absorption High Subgraphs (absorbed buying at / near bar high).
Displays the absorbed buying levels within each chart bar, price levels are evaluated starting from the bar high price.
Absorption Low +4 (SG10)
Absorption Low +3 (SG11)
Absorption Low +2 (SG12)
Absorption Low +1 (SG13)
Absorption Low +0 (SG13)
Default: Disabled = Ignore; Enabled = Transparent Left Side Tick Size Rectangle
Defines the subgraph draw style properties used for Absorption Low Subgraphs (absorbed selling at / near bar low).
Displays the absorbed selling levels within each chart bar, price levels are evaluated starting from the bar low price.