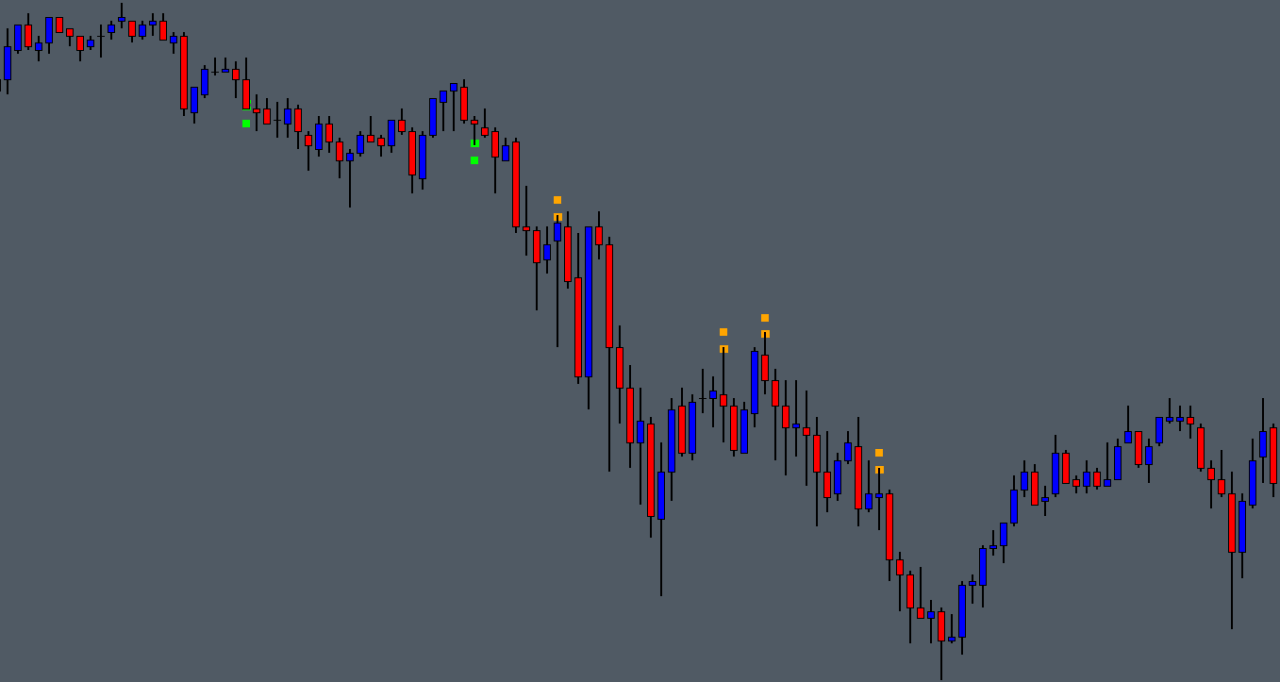
The Zero Print High Low study monitors volume at price data and checks for zero prints at the lowest and highest price levels within each chart bar, up to 5 zero prints can be display at the bar high and/or low be displayed per chart bar.
For the purposes of this study, a zero print at / near the bar high is defined as a price level where there is zero bid volume traded; conversely a zero print at / near the bar low is defined as a price level where there is zero ask volume traded.
In addition to displaying markers at zero print price levels, the study also displays a marker above and/or below the chart bar to indicate whether buy and/or sell side zero prints have been detected within the chart bar.
Note:
- This study can only be used on charts with a chart data type of ‘Intraday Chart‘
- It is recommended to use ‘Intraday Data Storage Time Unit‘ setting ‘1 Tick’
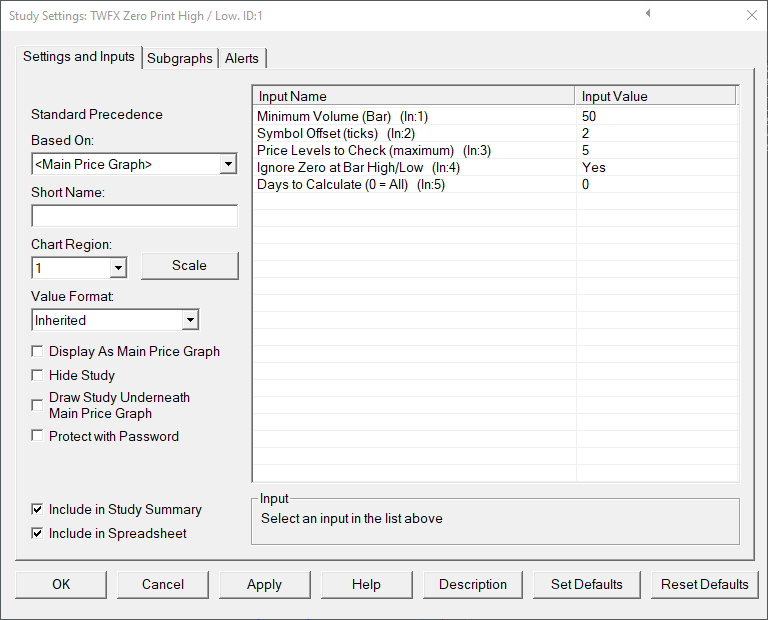
Inputs
Defines the minimum volume required for a chart bar to be evaluated for zero print volume at price.
- Min: 0
- Max: 1000000
Symbol Offset (In:2)
Defines the offset, in ticks, from the bar high/low at which to display the zero print symbol(s).
- Min: 0
- Max: 10
Defines the number of price levels at the high and low over which to check for zero prints. The number of levels checked will always be the lesser of ‘Price Levels to Check’ and ‘price levels per chart bar / 2’.
- Min: 1
- Max: 5
Ignore Zero at Bar High/Low (In:4)
When enabled, if a zero print is only detected at the bar high and/or low, then no indicator / symbol will be displayed on the chart, in other words, price levels will only be highlighted if 2 or more zero prints occur at/near the bar high and/or at/near the bar low.
Days to Calculate (In:5)
Defines the number of days over which the study is calculated, can be used to reduce the initial study calculation time when many days worth of data is loaded into the chart but this study is only required to be shown on the most recent days.
- Min: 0 (in which case all loaded bars are evaluated during the study calculation)
- Max: 1000000
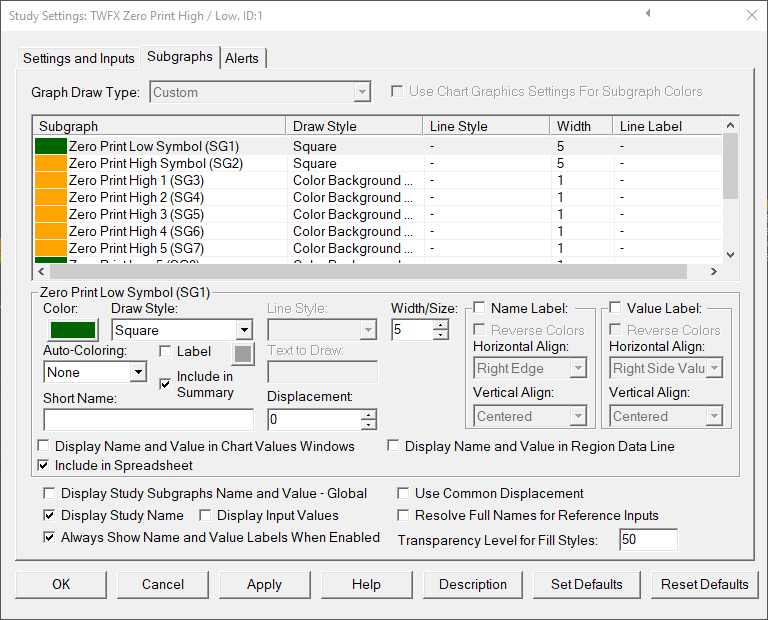
Subgraphs
Default: Square
Defines the subgraph draw style properties used for the Zero Print Low Symbol Subgraph
Displays a symbol at / below the bar low if a Zero print is detected within the specified price levels at/near the chart bar low price.
Zero Print High Symbol (SG2)
Default: Square
Defines the subgraph draw style properties used for the Zero Print High Symbol Subgraph
Displays a symbol at / above the bar high if a Zero print is detected within the specified price levels at/near the chart bar high price.
Zero Print High 1 (SG3)
Zero Print High 2 (SG4)
Zero Print High 3 (SG5)
Zero Print High 4 (SG6)
Zero Print High 5 (SG7)
Default: Color Background at Price
Defines the subgraph draw style properties used for Zero Print High Subgraphs.
Note: The draw style, color and size properties are automatically copied from subgraph 3 to subgraphs 4-7.
Displays the zero print high levels within each chart bar, price levels are evaluated starting from the bar high price.
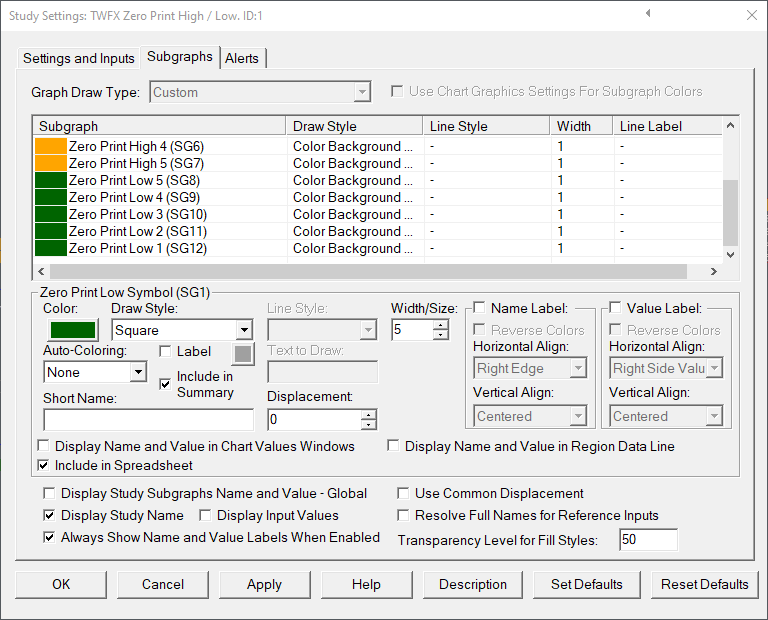
Zero Print Low 5 (SG8)
Zero Print Low 4 (SG9)
Zero Print Low 3 (SG10)
Zero Print Low 2 (SG11)
Zero Print Low 1 (SG12)
Default: Color Background at Price
Defines the subgraph draw style properties used for Zero Print Low Subgraphs.
Note: The draw style, color and size properties are automatically copied from subgraph 12 to subgraphs 11-8.
Displays the zero print low levels within each chart bar, price levels are evaluated starting from the bar low price.